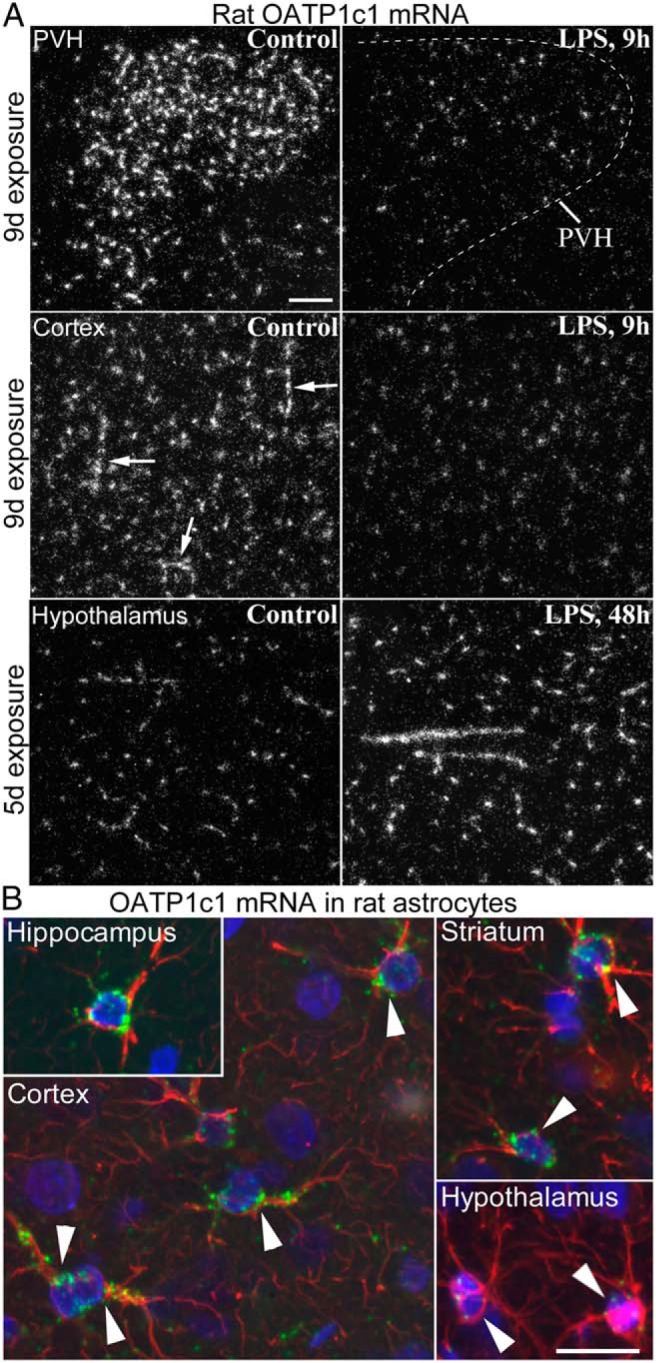
Figure 3. A, Darkfield emulsion autoradiography images illustrate the effect of LPS on OATP1c1 mRNA in the rat brain. The decrease in OATP1c1 mRNA levels at 9 h is demonstrated in hybridizations with longer exposure time, whereas shorter exposure was necessary to visualize the increase at 48h. The top panel shows the dramatic decrease of OATP1c1 mRNA in vessels of the hypothalamic paraventricular nucleus. Middle panel demonstrates the effect in the cortex, where hybridization in vessels is almost completely absent 9 h after LPS, and the remaining signal labels predominantly astrocytes. Arrows indicate longer vessel segments in the control cortex. The bottom panel demonstrates the robust increase in OATP1c1 mRNA levels in blood vessels at 48 h after LPS; images were taken from the hypothalamic dorsomedial nucleus. PVH, hypothalamic paraventricular nucleus. Scale bar = 100 μm. B, Fluorescent in situ hybridization demonstrates OATP1c1 mRNA in different astrocyte populations in the rat. Hybridization on paraformaldehyde-perfused sections shows high levels of OATP1c1 mRNA (green) in astrocytes of the hippocampus, cortex, and striatum. Note the numerous intense green puncta denoting OATP1c1 mRNA in the cytoplasm and proximal processes of astrocytes, which were identified by immunofluorescence for GFAP (red). In contrast, more sensitive hybridization using fresh-frozen sections was necessary to detect OATP1c1 mRNA in hypothalamic astrocytes. In these cells, hybridization signal concentrated in only a few, 5–8, smaller-sized puncta. Cell nuclei are labeled by the blue fluorescence of DAPI. Scale bar = 20 μm.