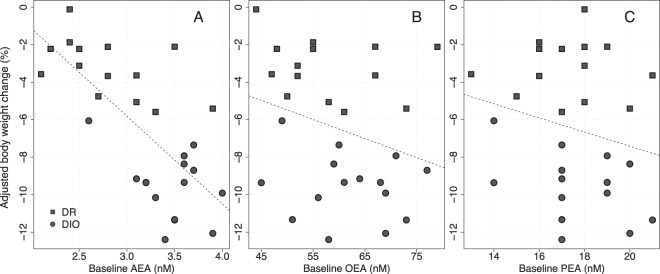
Figure 3. Correlation between adjusted body weight change and plasma levels at baseline for AEA (A), OEA (B), and PEA (C).

The dashed lines are the least-squares regression lines. DR and DIO represent the 2 subgroups of the mixed cohort in the study.
