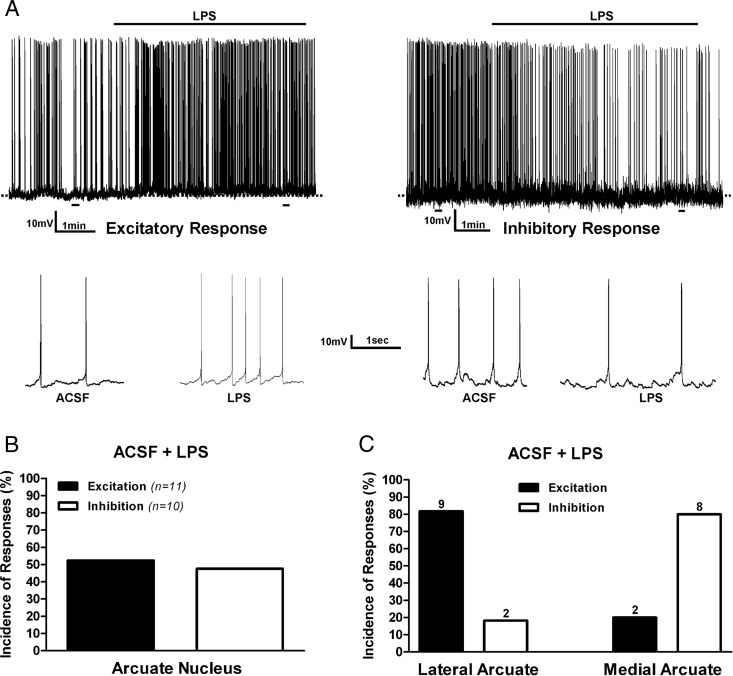
Figure 1. Effects of TLR4 activation on ARC neuronal activity.
A, Examples of electrophysiological recordings obtained from ARC neurons showing either an excitatory (left panel) or inhibitory (right panel) response to bath-applied LPS (10 μg/mL). The lower panels show action potentials at an expanded time scale, taken from the underlined areas from the upper panels. Summary of the incidence of excitatory and inhibitory neuronal responses observed in pooled ARC neurons (B) or according to neuronal distribution in lateral or medial ARC aspects (C). Numbers on top of bars are the number of neurons per group.

