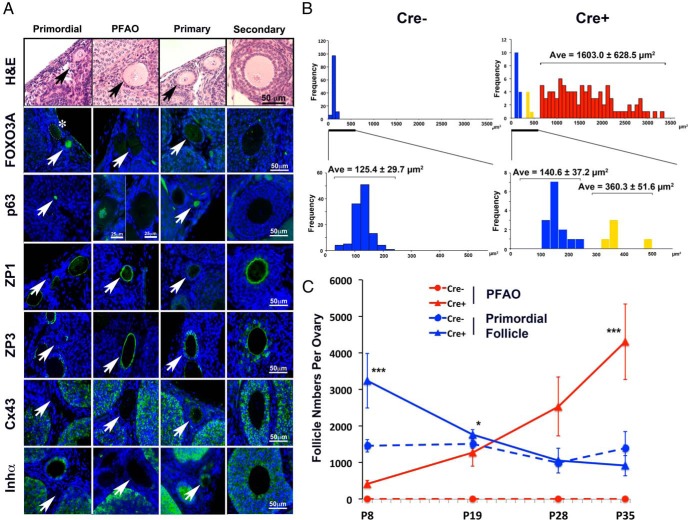
Figure 4. Characterization of PFAOs.
A, Follicle classes and their marker expression pattern. Each panel is in the same magnification (scale bar, 50 μm; unless it is marked). The follicle is marked with an arrow in each panel. IF detection (green) for FOXO3A, which is expressed in the nucleus of dormant primordial follicles; p63, which is expressed in the oocyte nucleus from primordial to early secondary stages; ZP1 and ZP3, which are expressed in the zona pellucida of activated oocyte; and Connexin 43 and inhibin-α, which are expressed in the granulosa cells of activated follicles. PFAOs were either positive or negative for p63 depending on the size, and small PFAOs were positive (left panel) similarly to the primary and early secondary follicles. PFAOs with an intermediate size oocyte (between 320 and 500 μm2) did not show nuclear FOXO3A expression (*, oocyte is outlined by dotted line). Blue, DAPI. Scale bar, 50 μm. B, Oocyte size distribution of primordial follicles. The 2-dimensional size (area) of primordial follicles was assessed in histology sections. The cluster of blue columns corresponded to histologically normal (dormant) primordial follicles, whereas the yellow and red columns corresponded to the primordial follicles with enlarged oocytes. The yellow cluster appears to represent the activated oocyte in the early stage. The size of oocytes in normal primordial follicles (blue) in Cre+ ovaries was comparable with that in Cre− ovaries. The average size ± SD in each group is indicated on the top of each cluster. C, Developmental changes in the number of PFAO and primordial follicles. Blue, dormant follicles; red, PFAOs; Cre−, dotted lines; Cre+, solid lines. At PD8, Cre+ ovaries contained a high number of normal primordial follicles with a smaller number of PFAO. As PFAO increased from PD8 to PD19, the number of normal primordial follicles significantly dropped in Cre+ ovaries. Consequently, the number of dormant primordial follicles in Cre− and Cre+ ovaries became comparable after PD19. *, P < .05; ***, P < .001.

