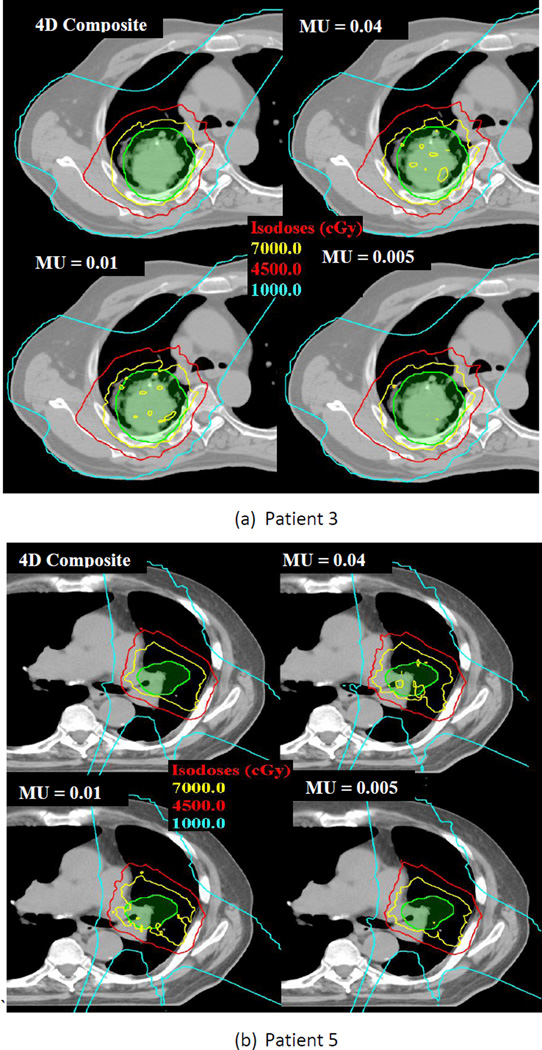
Figure 7.
Dose distributions of 4D composite and single-fraction 4D dynamic doses with different iso-layered re-scanning. The green color wash is the clinical tumor volume (CTV); the inner yellow line indicates the prescription isodose line (70 Gy); the red line indicates the 45 Gy isodose line; and the blue line contains the 10-Gy dose regions. Non-uniform doses in single-fraction dynamic doses for regular respiratory pattern were smoothed when maximum MU limit of 0.005 was used.

