
Figure 2.
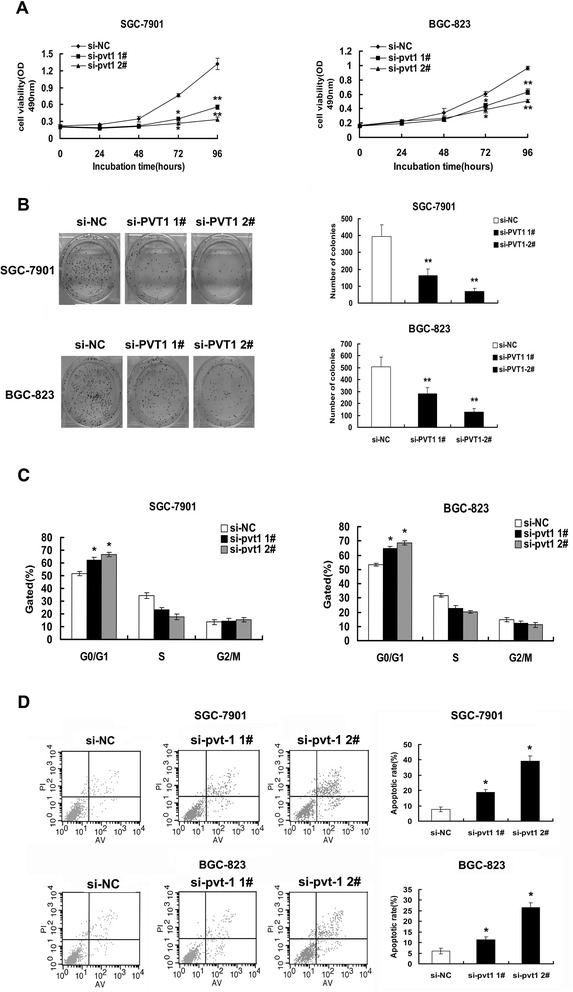
Effect of PVT1 on gastric cell growth in vitro. (A) Forty-eight hours after transfection, MTT assay was performed to detect the proliferation of SGC-7901 and BGC-823 cells. (B) Colony-forming growth assays were performed to determine the proliferation of SGC-7901 and BGC-823 cells. The colonies were counted and captured. (C) Forty-eight hours after transfection, cell cycle was analyzed by flow cytometry. The bar chart represented the percentage of cells in G0/G1, S, or G2/M phase, as indicated. (D) Forty-eight hours after transfection, the apoptotic rates of cells were detected by flow cytometry. LR, early apoptotic cells. UR, terminal apoptotic cells. Error bars indicate means ± S.E.M. *, P < 0.05, **, P < 0.01.