
Figure 3.
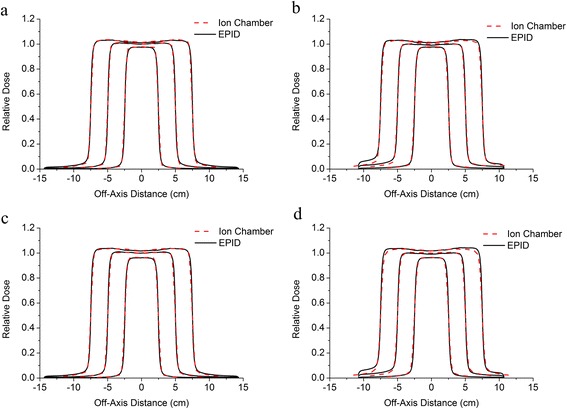
The fluence profiles on the central axis determined using the EPID (black solid lines) and using the ion chamber (red dashed lines): a) the cross-plane central axis for the 6 MV beam; b) the in-plane central axis for the 6 MV beam; c) the cross-plane central axis for the 10-MV beam; and d) the in-plane central axis for the 10 MV beam. The relative doses were normalized to the central dose of the 10 cm × 10 cm field.