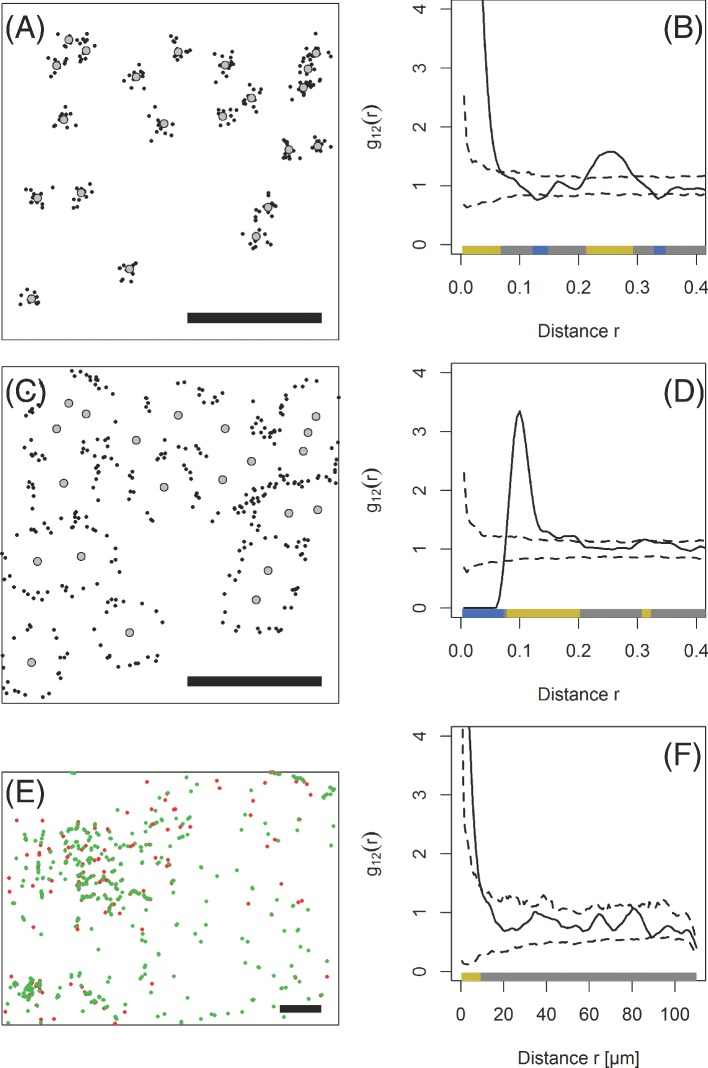
Figure 1.
Cross-type pair correlation functions [(B), (D) and (F), solid lines] of artificial and observed point patterns (A), (C) and (E). (A), (C): artificial point patterns in a unit square (scale bars are 0.4 units), (E): pattern of DsRed-labeled P. syringae (red) and GFP-labeled P. agglomerans (green) on a bean leaf (scale bar is 110 μm). If the function exceeds the simulation envelopes [(B), (D) and (F), broken lines] at scale r, the points are significantly aggregated at scale r. Values for g12(r) smaller than the lower bound of the simulation envelopes indicate a significant scarcity of points of pattern 2 at distance r of an arbitrary point of pattern 1. The colored bands (‘quantum plots’) at the bottom of the graphs depict the spatial scales at which the pair correlation functions deviate from the simulation envelopes. In pattern A, the black points were aggregated around the gray points up to a scale of 0.07 units. A second maximum around r = 0.25 units suggest a periodicity in the pattern that could arise from a typical distance of 0.25 units between clusters. In pattern C, the black points aggregated 0.1 units from the gray points but avoided coming closer than this. The P. agglomerans cells in E aggregated around P. syringae cells but no significant patterns were found at scales larger than 10 μm.

