Figure 2.

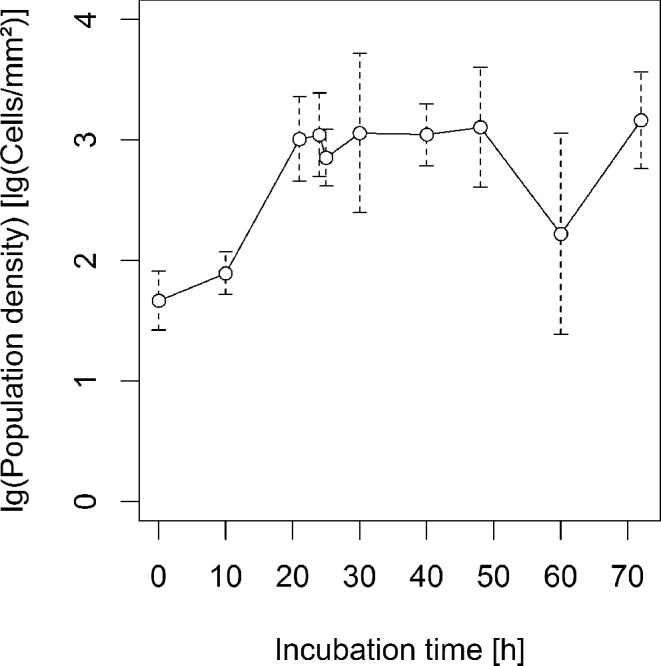
Mean bacterial population density (open circles) and standard deviation (broken lines) over time from all samples excluding samples where P. agglomerans was inoculated 92 h after P. syringae.

Mean bacterial population density (open circles) and standard deviation (broken lines) over time from all samples excluding samples where P. agglomerans was inoculated 92 h after P. syringae.