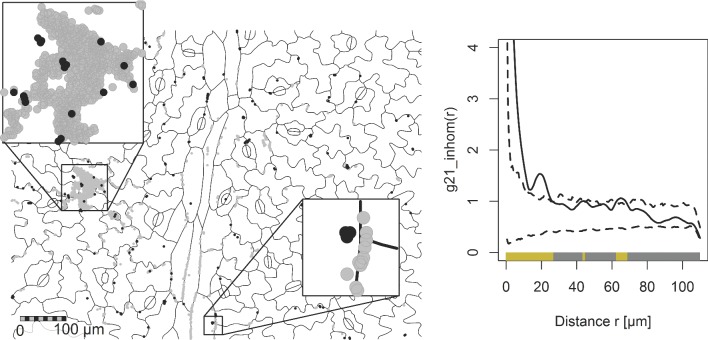
Figure 5.
Left: spatial pattern of P. agglomerans (gray points) and P. syringae (black points) on a bean leaf surface. Right: the inhomogeneous pair correlation function (PCF, solid line) and 95% simulation envelope (broken lines) for P. syringae cells near P. agglomerans cells derived from the pattern (interpretation of the PCF same as in Fig. 1). The spatial pattern is typical in the sense that the PCF result well resembles the general results for this interaction shown in Fig. 4B.

