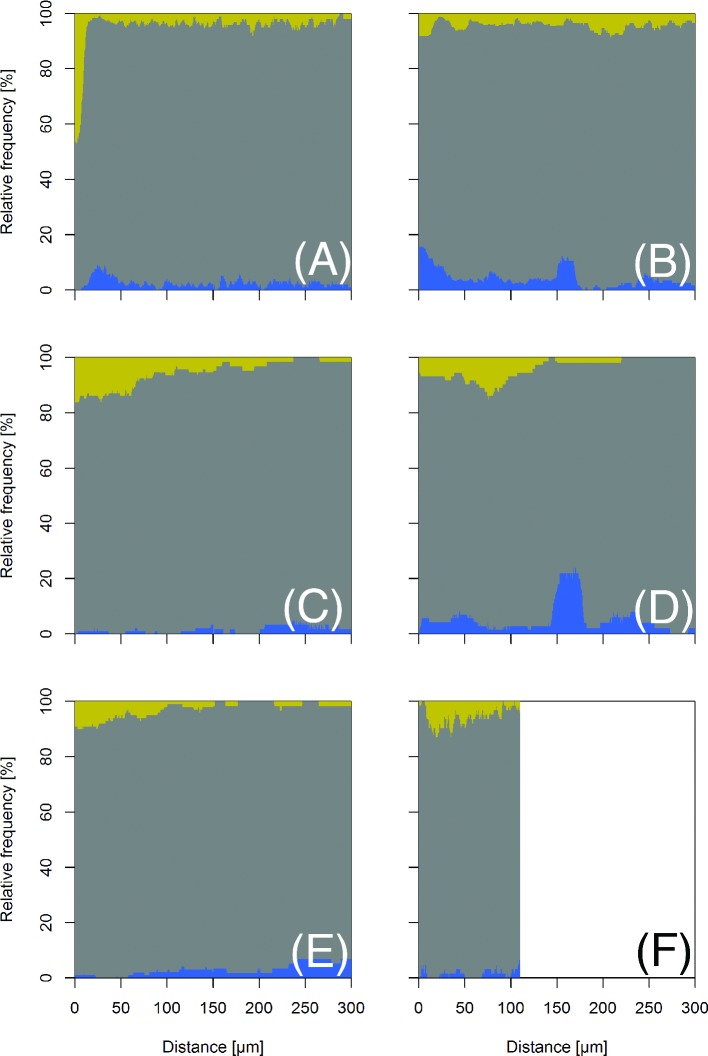
Figure 6.
Interactions of bacteria with structural elements of the bean phyllosphere. The graphs give the relative frequency of significant aggregation (yellow/light gray), randomness (medium gray) and scarcity (blue/dark gray) at different scales as determined by cross-type pair correlation functions (g12) using random toroidal shifts (cf. main text) as a null model. (A)–(E): homogeneous g12, (F): inhomogeneous g12. In (F), the local point density was estimated using a moving Gaussian smoothing kernel of bandwidth 110 μm, which limited our analysis up to this scale. (A): interaction of bacteria with grooves between epidermal cells. (B): interaction with stomata. (C): interaction with glandular trichomes. (D): interaction with hooked trichomes. (E)–(F): interactions with vein cells. Number of samples were 244 in (A) and (B), 93 in (C), 72 in (D), 99 in (E) and 62 in (F).

