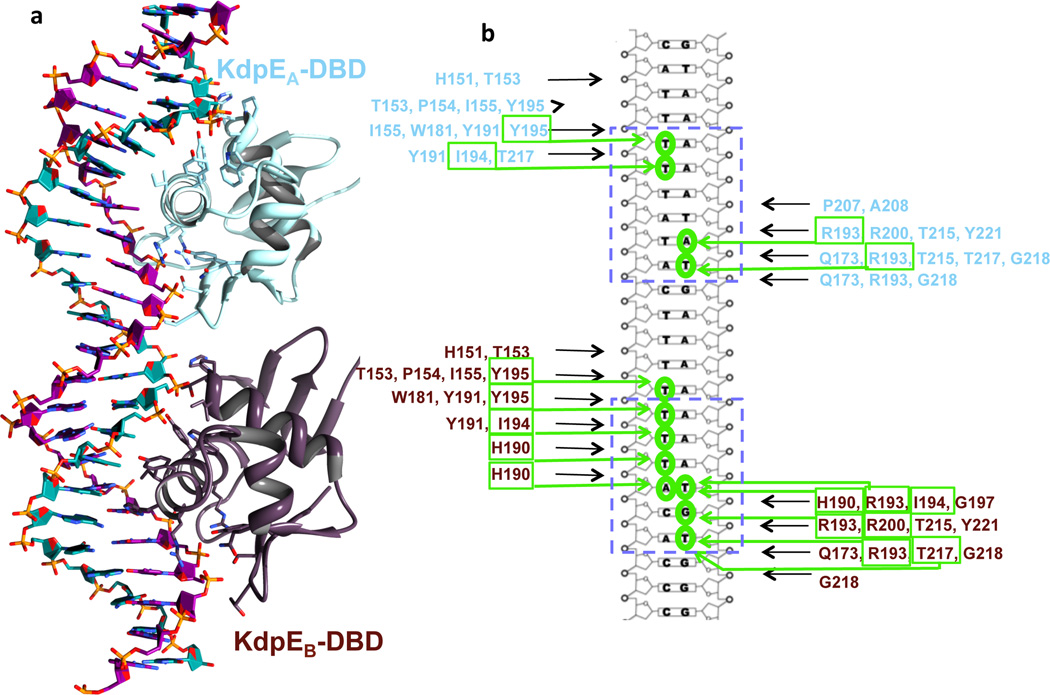
Figure 6. DNA-protein interactions.
a, Interaction of DBDs of chains KdpEA and KdpEB with major grooves at half-sites S1 and S2, respectively. The coloring scheme is as in Fig. 2. Side chains that interact with nucleotide bases are shown in stick representation. b, Contact map illustrating residues within 4.0 Å distance from nucleotide bases (green arrows) and the DNA backbone (black arrows). The half-sites S1 and S2 are boxed.

