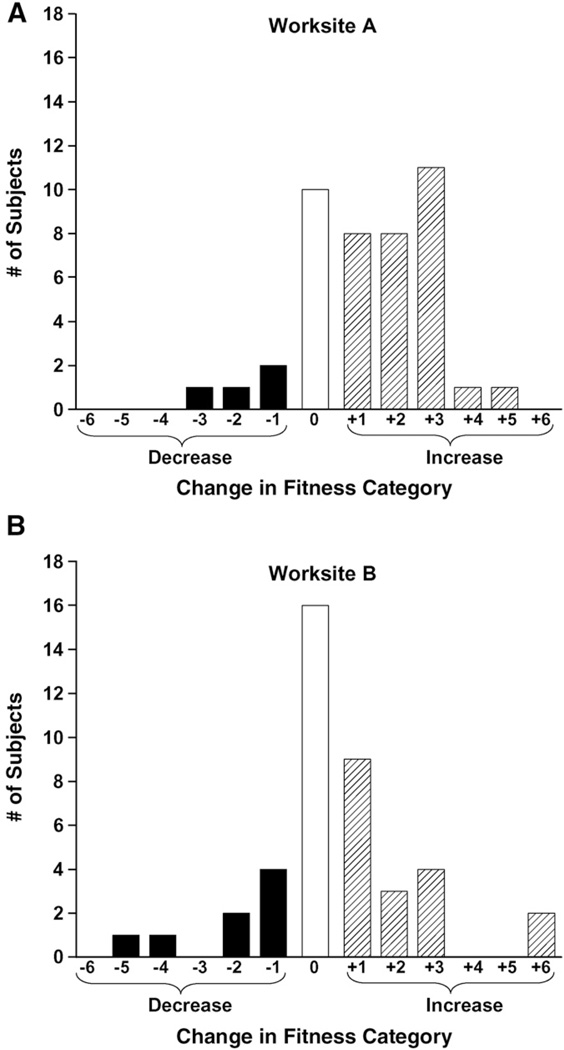
Fig. 2.
Changes in fitness categories from baseline to 1 year among 123 employees (St. Louis, MO, USA, 2005–2006). Worksite A: Assessments + Intervention; Worksite B: Assessments Only. The black bars to the left of 0 reflect the number of subjects who decreased 6, 5, 4, 3, 2, or 1 fitness category; the white bar at 0 indicates those whose fitness did not change; the striped bars to the right of 0 indicate those who increased their fitness by 1, 2, 3, 4, 5, or 6 categories.

