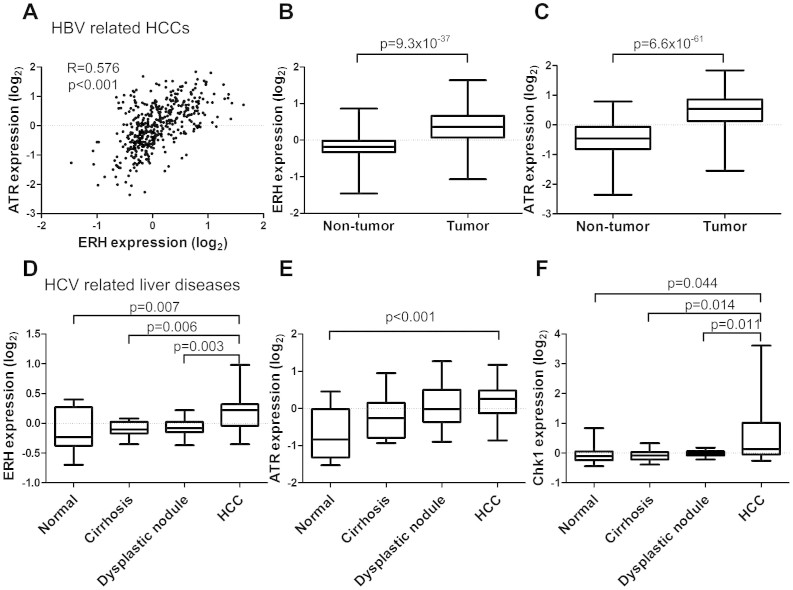
Figure 1. ERH expression in HBV and HCV related HCC and non-tumor liver tissue.
(A) Relationship between mRNA expression of ERH and ATR in liver tissue (correlation coefficient = 0.576, p < 0.001 by Spearman's method). (B) ERH mRNA and (C) ATR mRNA expression in tumor part and non-tumor part in HBV related HCCs. (D) ERH mRNA, (E) ATR mRNA, and (F) CHK1 mRNA expression in HCC, normal liver, cirrhosis and dysplastic tissue of HCV carriers. The p-values were less than 0.001 by one-way ANOVA for the comparison of all 3 genes. The p-values demonstrated in the panels were the results of post-hoc analysis by Bonferroni method.

