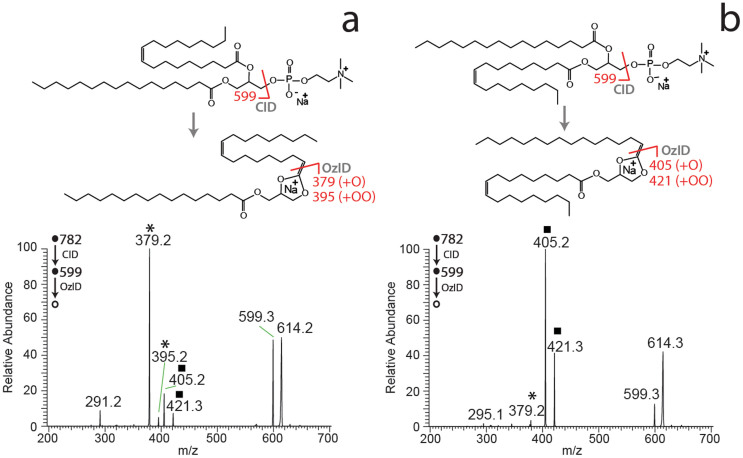
Figure 2. DESI-CID/OzID mass spectra obtained from [M+Na]+ ions of synthetic glycerophospholipids (a) PC 16:0/18:1(9Z) and (b) PC 18:1(9Z)/16:0.
The CID/OzID peaks indicative of the presence of the 18:1 chain at the sn-2 position (*) and 16:0 at the sn-2 position (▪) are marked. The dissociation pathways for the two ionized glycerophospholipid sn-positional isomers are indicated above the corresponding mass spectra. Putative dissociation pathways are based on the study of Pham et al.19 and full reaction mechanisms for CID and OzID steps are provided as Supporting Information (Scheme S1). Spectra acquired using offline ozone generation (see Methods).

