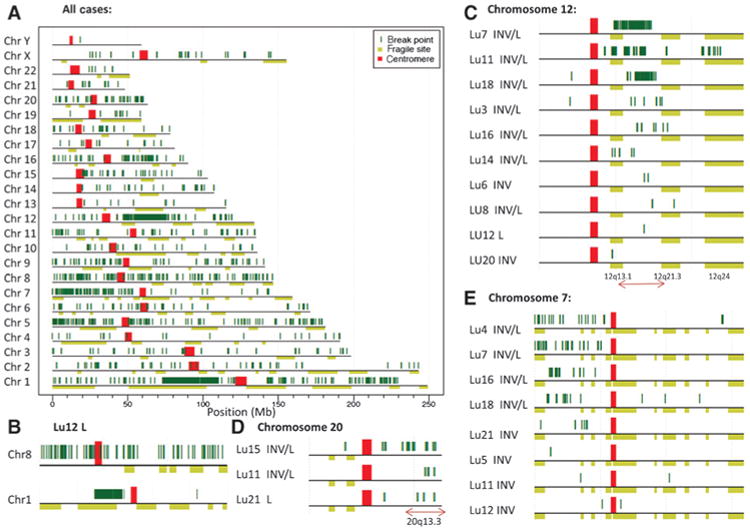
Figure 2.

Mapping of breakpoints to the human genome. A, all breakpoints (dark green vertical lines) for the 28 samples mapping to each chromosome. Chromosomes are presented p to q arms (left to right) with the centromeres marked in red. Horizontal light green bars below each chromosome mark predicted chromosomal fragile sites described in ref. 16. B, breakpoints hitting chromosomes 1 and 8 for Lu12 lepidic. C–E, cases with breakpoints in common regions of chromosomes 12, 20, and 7 (respectively). INV, invasive; L, lepidic.
