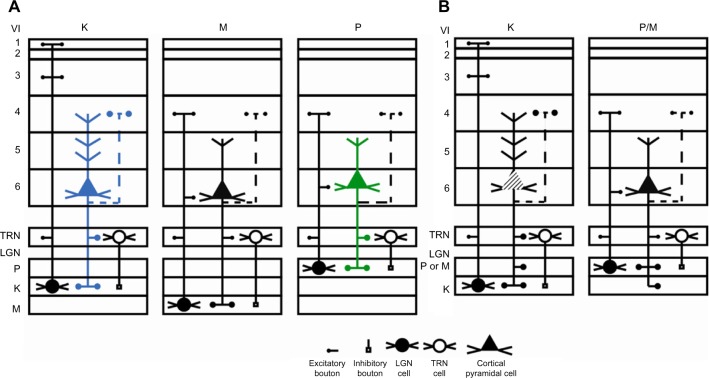
Figure 16.
Schematic diagram summarizing two interpretations of the main corticogeniculate pathways in primates.
Notes: (A) Shows the three main pathways in the macaque monkey. The K pathway (blue) is shown on the left and represents only the blue on-portion of the K pathway based on a combination of anatomical and physiological data.12 The M pathway (black) is in the center and the P pathway (green) is on the right. (B) Compares the M and P pathways in bush babies and owl monkeys14 with the K pathway based primarily on anatomical data. The K pathway (striped) is shown on the left and the P/M pathways are shown on the right. Symbols below the figure identify different features. Arabic numerals refer to the V1 layers. Dotted lines indicate data either not shown or not part of this study but demonstrated in other studies.
Abbreviations: K, koniocellular; LGN, lateral geniculate nucleus; M, magnocellular; P, parvocellular; TRN, thalamic reticular nucleus; V1, primary visual cortex.

