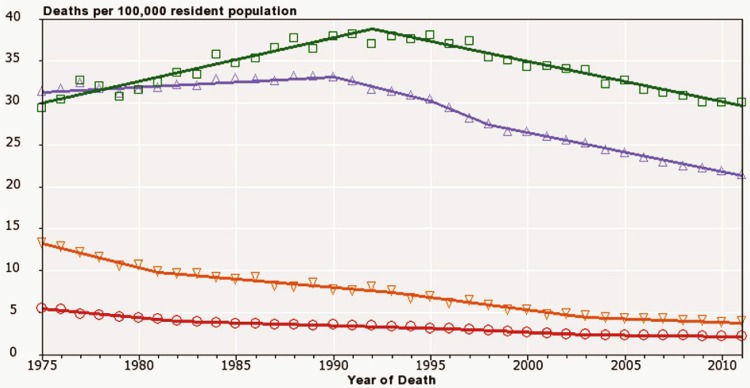
FIGURE 1.
Historical trends in U.S. female mortality from cervical and breast cancer, 1975–2011, all ages. Open squares = breast cancer, black and Hispanic; open triangles = breast cancer, all races; open reverse triangles = cervical cancer, black and Hispanic; open circles = all races. Source: Death data provided by the U.S. National Vital Statistics System public-use data file. Death rates calculated by the U.S. National Cancer Institute (nci) using seer*Stat. Rates are age-adjusted to the 2000 U.S. standard population (19 groups: <1. 1–4, 5–9, ... 80–84, ≥85 years). Population counts for denominators are based on census populations as modified by the nci. The populations included with the data release have been adjusted for the population shifts resulting from Hurricanes Katrina and Rita for 62 counties and parishes in Alabama, Mississippi, Louisiana, and Texas. 1969–2012 U.S. Population Data File is used with mortality data.

