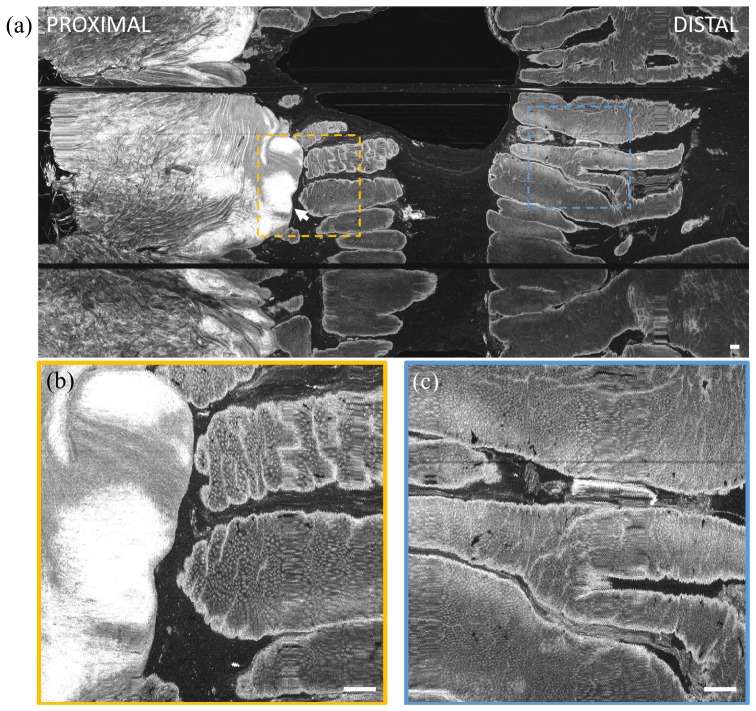
Fig. 8.
(a) En face OCT image of swine dentate line in vivo at 300 μm below the tissue surface and projected over 50 μm depth range. The capsule was manually advanced for the longitudinal scan. Insets (b, c) show zoomed in regions. The transition from squamous epithelium to columnar crypts (arrow) is clearly visible. Scale bar is 1 mm.

