
Fig. 2.
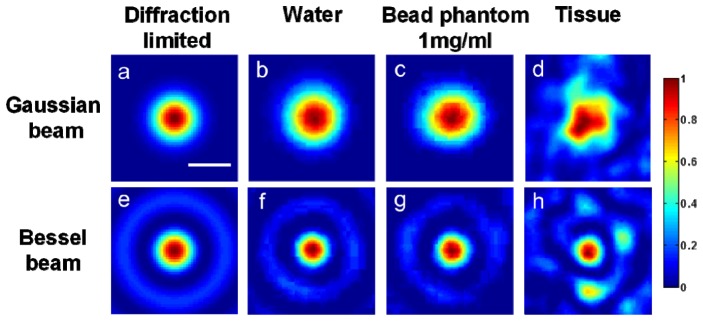
The normalized irradiance of focused Gaussian and Bessel beams. From left to right, the columns represent: (a,e) simulations of diffraction-limited beam foci, (b,f) beam foci imaged in water, (c,g) beam foci imaged in bead phantoms (1 mg/ml concentration), and (d,h) beam foci imaged in fresh mouse esophagus tissues. The scale bar measures 1 µm.