
Fig. 3.
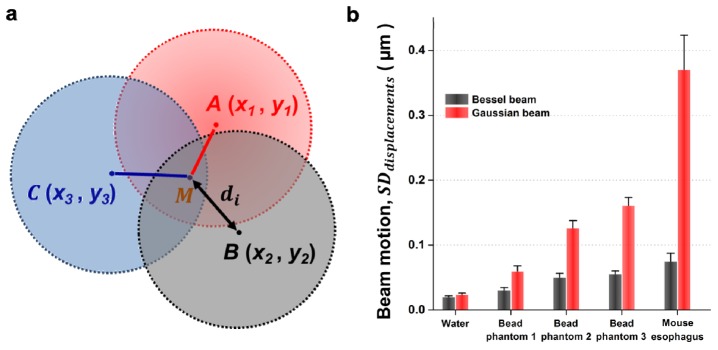
(a) A depiction of how “di” is calculated, where di is the displacement between the position of individual snap-shot images of beam foci (A,B,C,…) and the average position (unperturbed beam position), M. See Methods for additional details. (b) The standard deviation in the displacement of focused Gaussian and Bessel beams in water, bead phantoms and fresh mouse esophagus tissues. Each set of data contains 100 successive snap-shot images of a beam focus. Error bars represent the variability between five sets of data. Bead phantoms 1, 2, and 3 are at concentrations of 0.25 mg/mL, 0.50 mg/mL and 1.00 mg/mL, respectively.