Abstract
While optical coherence tomography (OCT) has been shown to be capable of imaging coronary plaque microstructure, additional chemical/molecular information may be needed in order to determine which lesions are at risk of causing an acute coronary event. In this study, we used a recently developed imaging system and double-clad fiber (DCF) catheter capable of simultaneously acquiring both OCT and red excited near-infrared autofluorescence (NIRAF) images (excitation: 633 nm, emission: 680nm to 900nm). We found that NIRAF is elevated in lesions that contain necrotic core – a feature that is critical for vulnerable plaque diagnosis and that is not readily discriminated by OCT alone. We first utilized a DCF ball lens probe and a bench top setup to acquire en face NIRAF images of aortic plaques ex vivo (n = 20). In addition, we used the OCT-NIRAF system and fully assembled catheters to acquire multimodality images from human coronary arteries (n = 15) prosected from human cadaver hearts (n = 5). Comparison of these images with corresponding histology demonstrated that necrotic core plaques exhibited significantly higher NIRAF intensity than other plaque types. These results suggest that multimodality intracoronary OCT-NIRAF imaging technology may be used in the future to provide improved characterization of coronary artery disease in human patients.
OCIS codes: (170.4500) Optical coherence tomography; (170.3880) Medical and biological imaging; (170.2150) Endoscopic imaging; (170.6280) Spectroscopy, fluorescence and luminescence
1. Introduction
Coronary atherosclerosis is the major cause of coronary heart disease that results in more than 370,000 deaths per year in the United States [1, 2]. As estimated by ex vivo human cadaver studies [3–6], approximately 60% of patients who die of acute coronary syndromes have thin-capped fibroatheroma (TCFA) as the culprit lesion at the site of coronary thrombosis [3, 4]. TCFA are characterized histologically by the presence of a necrotic, lipid-rich core underneath and a thin (<65 µm) fibrous cap.
Optical coherence tomography (OCT) is a catheter based microstructural imaging technology with an axial resolution of approximately 10 µm [5]. OCT has been shown to discriminate fibrous, lipid-rich, and calcified plaques [6–8] and measure cap thickness with a resolution that is sufficient for the identification of thin fibrous caps (i.e., <65 µm) [8].
Although it is recognized that OCT is capable of enabling the visualization and quantification of many important plaque microstructural features, its ability to be used to differentiate necrotic core from non-necrotic lipid-rich lesions has not been established [9, 10]. In OCT, extracellular lipid manifests as a signal poor region that has diffuse borders with respect to the surrounding tissues [10] and a rapid signal decay with depth. These features result from high scattering and attenuation seen in lipid-containing tissues [11, 12]. However, these negative contrast features are not specific for necrotic core, as both necrotic lipid and non-necrotic lipid may have similar image characteristics. In addition, strong attenuation in plaque may be caused by other tissue components, including macrophages and blood. Also, OCT images can have artifacts (e.g., tangential signal dropout), which can also cause rapid signal attenuation that mimics the appearance of lipid [13].
One approach for improving the diagnosis of TCFA is to add a second imaging modality to the existing OCT imaging platform that provides a direct link to plaque composition. Near-infrared autofluorescence (NIRAF) is one such imaging modality that may provide complementary information about chemical/molecular tissue information [14]. Multiple groups have investigated atherosclerotic plaque autofluorescence [15–19]. However, these studies were limited to UV and visible light. In a previous Raman study of ex vivo human aortic plaques [20], it was observed that necrotic cores appear to exhibit a strong NIRAF signal (excitation wavelength is >700nm). This observation motivated the development of a catheter-based imaging system combining OCT and red excited NIRAF (excitation 633nm, emission 680-900nm) to further investigate the diagnostic potential of OCT-NIRAF for the identification of TCFA.
In this paper, we describe the use of fiber-based NIRAF measurements to detect necrotic cores in aortic plaques ex vivo and an OCT-NIRAF system and catheter to acquire multimodality images from human coronary arteries from autopsy specimens. We have compared the NIRAF and OCT-NIRAF images to histology in order to evaluate the potential of NIRAF to add critical missing information to OCT. Our results indicate that catheter-based OCT-NIRAF has the potential to enable improved diagnosis of necrotic core lesions.
2. Methods
The OCT technique used in this paper is optical frequency domain imaging (OFDI) [8], also referred to as swept source OCT [21]. Reflected wavelength swept light from the tissue (sample arm) and fixed mirror (reference arm) generates spectral interference. A Fourier transform of the spectral interference is utilized to reconstruct the reflectivity as a function of depth (A-line) that reveals the depth-resolved tissue microstructure. Cross-sectional images are composed of continuously scanned A-lines, acquired while the optics within the catheter are rotated. NIRAF emission was excited by continuous wave 633 nm light delivered onto the tissue. A broad emission band was collected and integrated at each tissue site. Scanning the tissue en face generated a NIRAF intensity map. To combine the two modalities for multimodality intracoronary imaging, we simultaneously acquired NIRAF at the A-line rate of OFDI through the fiber optic catheter. The NIRAF probe is described in more detail in the following subsections.
2.1 Bench top NIRAF detection of ex vivo aortic plaques
2.1.1 OCT-NIRAF probe
In order to test the feasibility of detecting NIRAF through an optical fiber, a 2-meter long OCT-NIRAF probe using a double clad fiber (DCF) (FUD-3236, Nufern Inc., East Granby, CT, USA) was fabricated. The probe was created by splicing a short segment of coreless fiber to the distal end of the DCF, which was subsequently shaped into a spherical ball lens using a computerized fiber splicer (FFS2000, Vytran Inc., Morganville, NJ, USA) [18]. The ball lens is capable of focusing and collecting both OCT and NIRAF light to and from the tissue. The single mode core of the DCF (mode field diameter 9.2 µm, NA = 0.12) was used to guide OCT light (center wavelength = 1310 nm, bandwidth = 120 nm), which was similar to that employed in standard OCT catheters for clinical imaging [8]. The multimode inner cladding (NA> = 0.46, diameter = 124-126 µm, fiber outer diameter = 250 µm) was used to guide 633 nm excitation light and to collect NIRAF tissue emission. The working distances for OCT and NIRAF were 2 mm and 0.5 mm, respectively. The focal spot size for OCT and NIRAF was 27 µm and 100 µm, respectively. Since silica is a major component in the optical fiber, it is necessary to avoid the silica Raman bands in the NIRAF detection window. Figure 1 is a typical silica Raman spectrum measured from fused silica. The spectrum is overlaid with the pass band of our long pass NIRAF emission filter (cut-off wavelength = 675nm, Semrock, Rochester, New York, USA). This integration window avoids the major Raman peaks (640-670nm).
Fig. 1.
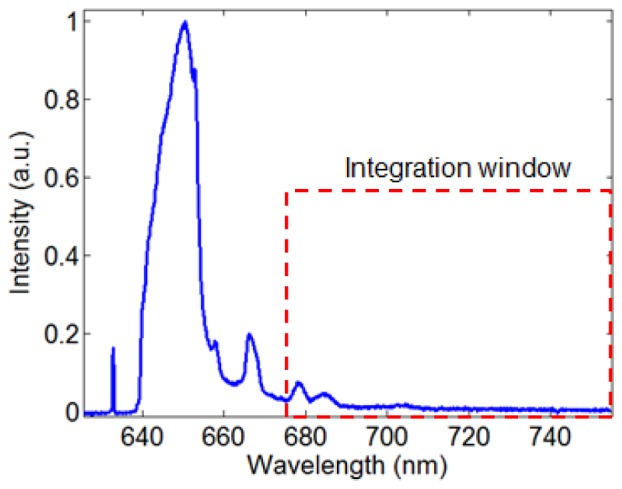
Typical silica Raman spectrum obtained from fused silica. The red dashed rectangle shows our NIRAF emission window, which avoids the major silica Raman peaks.
2.1.2 Bench top NIRAF imaging system
To conduct en face imaging of ex vivo aortic plaques, a bench-top NIRAF system was custom built. Light from a single mode fiber coupled 633 nm He:Ne laser (Thorlabs, New Jersey, USA) was cleaned by a narrow line band pass filter (Semrock, Rochester, New York, USA), coupled into the cladding of the OCT-NIRAF probe and focused onto the tissue by the ball lens. The raster scan of the beam on the tissue was achieved by a motion controller (ESP301, Newport Corp., Irvine, CA, USA). The remitted NIRAF light from tissue was collected by the cladding. A long pass filter with a cut-off wavelength of 675 nm (Semrock, Rochester, New York, USA) was used to remove the remitted laser light and silica Raman generated by the fiber. The collected NIRAF light (emission wavelength range 675nm to 900nm) was focused onto a photomultiplier tube (PMT, model H-5784, Hamamatsu, Japan) operating at 40 kHz, which is the same as the A-line rate of the OCT-NIRAF system used in the coronary artery measurement below. The PMT output was digitized by a data acquisition board (PCA-6110, National Instruments, Texas, USA).
2.1.3 Experimental protocol
En face NIRAF imaging of 20 fresh human aortic atherosclerotic plaques was conducted ex vivo, including necrotic core plaques (n = 5), pathological intimal thickening (n = 5), fibrocalcific plaques (n = 5), and intimal hyperplasia (n = 5). The plaques were dissected from human cadaver aortas within 24 hours after autopsy and saved in 10% phosphate buffered saline (PBS) at 4 °C. The plaques were kept flat in 10% PBS at 37° C during bench top NIRAF imaging. The excitation power measured at the distal end of the catheter was 2 mW. The ball lens was held 2 mm from the plaque surface. During the scan, the probe was held still, while the motion controller raster scanned the tissue in two dimensions. The step size was 250 µm along both X and Y direction. The fiber background was estimated by focusing the probe into the air; the resulting signal was recorded as a baseline, which was subtracted during post-processing. The study was approved by Partners IRB (protocol l#2004P000578).
2.1.4 Histology processing
After the scan, the corners of the tissue region that was imaged and the tissue sites that were to be dissected for histology were labeled with tissue marking dye. A photo of the tissue region was taken by a digital camera to provide gross pathology. The NIRAF map was registered with tissue gross pathology using the marks on the corners. The NIRAF intensity profile was also registered with the tissue specimen that was then dissected, fixed in 10% formalin, and processed for histology (H&E, Trichrome). A board-certified pathologist read all histology slides and provided a diagnosis of plaque type.
2.1.5 Data processing
The fiber background was subtracted from the raw NIRAF data. The corrected NIRAF data was divided by the 633 nm excitation power. The two-dimensional NIRAF image was reconstructed according to the raster scan pattern and registered with the gross pathology photo using the tissue-marking-dye labels. The NIRAF intensity profile was extracted from the sites where the specimen was cut for histology. Since the scan was operated by a linear motion stage, the NIRAF points were evenly distributed across the tissue specimen.
2.1.6 Data analysis
NIRAF and histology data from a total of 20 aortic plaques from 10 patients were collected and compared. For each plaque, the NIRAF intensity profile was spatially registered with corresponding histology slide. Individual NIRAF intensity data points were selected from tissue sites within the regions of interest (ROI). The ROIs were defined using histology as follows: for NC plaques, the ROI encompassed tissue sites that contained necrotic core; for PIT plaques, the ROI delineated the extracellular lipid pool; for CA plaques, the ROI flanked the calcified nodule/plate; for IH lesions, the ROI was set at the tissue sites that contained intimal thickening. The histopathologic diagnosis for each NIRAF data point was tabulated. NIRAF intensity data points from the same type of plaques were combined for comparison. A total of 115, 100, 123, 133 sites were selected from NC, PIT, CA, and IH regions, respectively. The NIRAF intensity was normalized by the maximum intensity measured from all of the tissue sites. Differences in normalized NIRAF intensities between all lesion types were analyzed using one-way analysis of variance (ANOVA). Differences between two different lesion types were analyzed using a one-tailed Student’s t-test. A p value of less than 0.05 was considered statistically significant.
2.2. Catheter based OCT-NIRAF imaging of human coronary arteries ex vivo
2.2.1 OCT-NIRAF catheter
The OCT-NIRAF imaging catheter was fabricated using the same DCF employed for the bench top experiments described above. The catheter was created by inserting the DCF probe discussed in section 2.1 into a stainless steel drive shaft allowing for mechanical rotation of the catheter. The drive shaft was enveloped by a soft transparent plastic sheath to protect the vessel wall during shaft rotation [18]. The outer diameter of the fully functional catheter (including the plastic sheath) was 0.87 mm (2.6 F), identical to that of a standard clinical OFDI catheter [8]. Since the optical core was identical to that of the OCT-NIRAF probe in Section 2.1.1, the working distances for OCT and NIRAF were 2 mm and 0.5 mm, respectively. The focal spot sizes for OCT and NIRAF were 27 µm and 100 µm, respectively.
2.2.2 OCT-NIRAF preclinical imaging system
To acquire OCT-NIRAF images from ex vivo coronary arteries through a catheter, a recently developed multi-modality OCT-Fluorescence imaging system [22] (Fig. 2 ) was modified. A single mode fiber coupled 633 nm He: Ne laser (Thorlabs, New Jersey, USA) was used for NIRAF excitation. The 633 nm laser source was coupled into the cladding of the catheter using long pass dichroic mirrors (cut-off wavelength is 635 nm) within the rotary junction. NIRAF emission was collected by the cladding of the catheter and guided back to the rotary junction, where the back scattering excitation and fiber-Raman photons were removed using a long pass filter (cut off wavelength is 675 nm). The collected NIRAF signal (emission wavelength 675- 900nm) was focused onto a PMT (H-5784, Hamamatsu, Japan) and digitized by a data acquisition board (PCA-6110, National Instruments, Texas, USA). The NIRAF excitation power on the tissue was 2 mW.
Fig. 2.
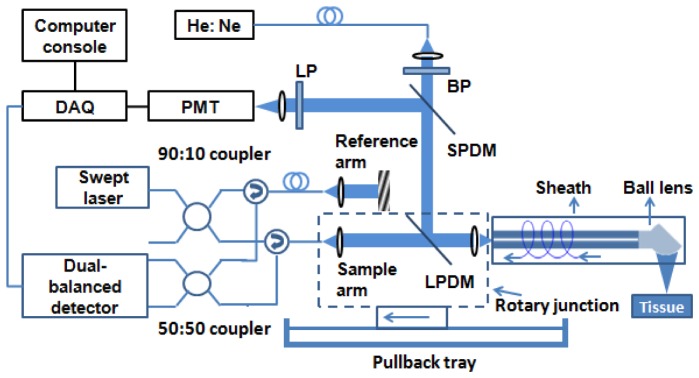
OCT-NIRAF system schematic. BP – band pass filter, LP – long pass filter, SPDM – short pass dichroic mirror, LPDM – long pass dichroic mirror, DAQ – data acquisition board. The catheter was connected to the rotary junction, which rotated the optics within the sheath. The rotary junction was translated by a pullback tray to effectuate a helical scan.
The OFDI module comprised a 40 kHz swept source laser with a center wavelength of 1310 nm and a bandwidth of 120 nm (i.e., 1250-1370 nm). The light from the sample arm was coupled into the imaging catheter by the rotary junction and focused onto the tissue. The interference between the reference arm and the back reflected light from the tissue through the core of the catheter was recorded by a dual-balanced detector. Signals from the dual balanced detector and the PMT were simultaneously digitized for subsequent processing.
2.2.3 Experimental protocol
Fresh explant human hearts (n = 5) were obtained from Capital Biosciences Inc. (Gaithersburg, MD). Hearts were packed in University of Wisconsin solution with ice bedding and shipped within 24 hours after the harvest procedure. The 3 main coronary arteries from each heart were dissected, including the right coronary artery (RCA), the left circumflex artery (LCA), and the left anterior descending artery (LAD). Before the experiment, the lumen was flushed with PBS to facilitate catheter access. During the experiment, to maintain the natural diameter and shape of the coronary lumen, PBS from a peripheral IV line flowed through the coronary. The PBS liquid pressure was around 110 mmHg, which was considered adequate to maintain the natural shape and size of the lumen.
As detailed above, the power of 633 nm NIRAF excitation light on the tissue was set to 2 mW. The sampling rate of NIRAF signal was 40 kHz, enabling integration of the NIRAF emission within the period of a single A-line. Each OFDI frame consisted of 1,024 A-lines, with a frame rate of 39 frames/sec (40 kHz/1024). The rotary junction was operated at 39 rotations per second so each OFDI image covered one rotation. The pullback rate was 5 mm/s. Before the experiment, the catheter was immersed in PBS so as to acquire an OCT background and NIRAF baseline.
Each coronary artery was fastened on cork and covered with PBS-containing wet gauze pad. The sheath was inserted into the coronary artery and the starting point of the pullback was labeled with tissue marking ink. PBS from a peripheral IV line continuously flushed the coronary artery lumen until the pullback scan was finished. The length of the pullback was between 5 cm to 10 cm, depending on the actual length of the coronary artery. The endpoint of the pullback was also labeled by tissue marking ink. The study was approved by Partners IRB (protocol l#2004P000578).
2.2.4 Histology processing
After the scan, the coronary arteries were perfused with a 10% formalin flush for 20 minutes. This tissue fixing procedure maintained the shape and size of the coronary lumen, which facilitated the comparison of OCT-NIRAF images and histology. The fixed coronary artery was bread loafed with 5 mm spacing. Each specimen was paraffin fixed and 5 µm sections were cut every 100 µm and stained with H&E and Trichrome. Since the start and end points of the OCT-NIRAF pullback were marked on the coronary artery tissue before cutting, the position of each histology slide was matched with OCT-NIRAF frame. A board-certified pathologist read all histology slides and provided a diagnosis of plaque type.
2.2.5 Data processing
The post-processing of OCT-NIRAF data sets included the following steps:
a) Background removal: The OCT background images of PBS solution were averaged and subtracted from each OCT image of the coronary artery; the NIRAF background signal of PBS solution was also averaged and subtracted from the coronary NIRAF intensity profile.
b) Distance calibration: Since the intensity of the detected NIRAF signal drops as a function of the distance between the imaging catheter and the vessel wall, the NIRAF signal was corrected accordingly. The distance between the imaging catheter and the luminal surface was measured using OCT images by the means of an automatic segmentation algorithm, as previously described [23]. The NIRAF signal was corrected using a predetermined calibration curve that relates the true NIRAF signal to distance between the catheter and the luminal surface [23].
c) NIRAF signal normalization: To compare NIRAF intensity among different plaques and pullbacks, all final NIRAF data were normalized by dividing the maximum NIRAF intensity from all plaques in this study. As a result, the NIRAF scale for all presented images ranges from 0 to 1. The normalized NIRAF signal was rendered as a ring shaped image, where each NIRAF data point matches the corresponding OCT A-line at each given rotational position of the catheter. The ring image and the OCT image were merged into different color channels (e.g. Fig. 6 and Fig. 7).
Fig. 6.
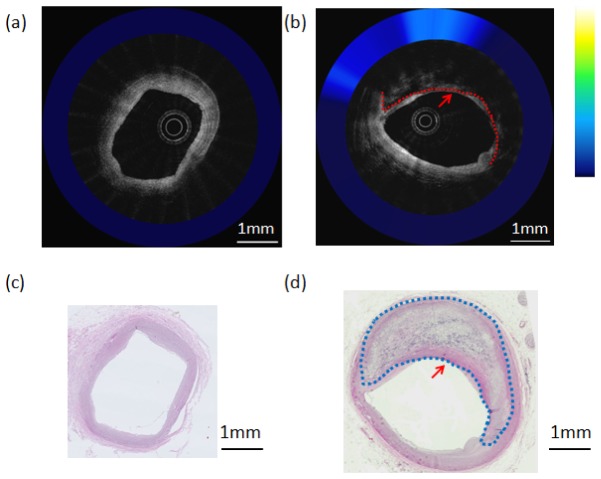
OCT-NIRAF composite images and corresponding H&E stained slides. a) OCT-NIRAF image of neointimal hyperplasia; taken at the location of the dashed line in Fig. 5; b) OCT-NIRAF image of a fibrocalcific plaque, taken at the location of the dotted line in Fig. 5. The red dotted line delineates the calcified region on OCT. c) Corresponding H&E stained slide for the OCT-NIRAF image in (a) showing intimal hyperplasia; d) Corresponding H&E stained slide for OCT-NIRAF image in (b), showing a fibrocalcific lesions. The dotted lines in (b) and (d) outline the region of calcification in the fibrocalcific plaque. Scale bars represent 1 mm. The arrows in (b) and (d) point to regions where the calcification abuts the luminal surface.
Fig. 7.
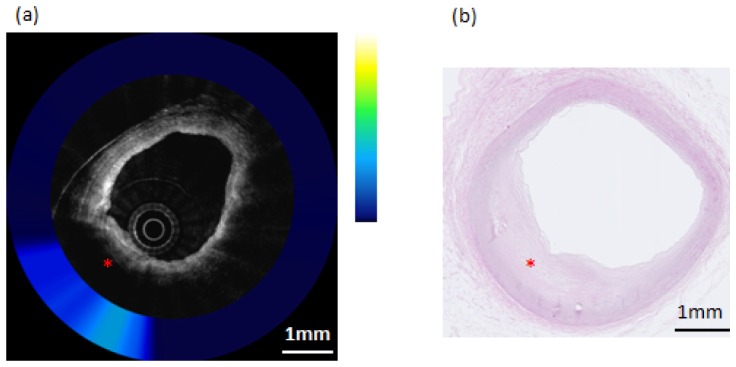
Composite OCT-NIRAF image and corresponding histology for a non-necrotic lipid containing plaque (Pathological Intimal Thickening–PIT). a) The OCT image indicates the presence of an area of high attenuation suggestive of lipid pool (star). The NIRAF signal is elevated, but only moderately so, over the lipid pool location. b) H&E stained slide confirming that this lesion (star) is pathological intimal thickening. The scale bars for both (a) and (b) represent 1mm.
2.2.6 Data analysis
A total of 15 coronary arteries from 5 human cadaver hearts were imaged using the multimodality OCT-NIRAF system and catheter. From these 15 coronary arteries, we analyzed NIRAF intensity from 37 distinct artery wall regions: coronary necrotic core/ruptured plaques (n = 3), pathological intimal thickening plaques (n = 2), calcified plaques (n = 12), and regions of intimal hyperplasia (n = 20). Using morphological features from the OCT image, NIRAF intensity profile across each OCT-NIRAF frame was spatially registered with the corresponding histology slide. Since the rotary junction was operated at a constant rotation and pullback speed, NIRAF intensity points were evenly acquired and matched to histology. Individual NIRAF intensity data points were selected from tissue sites on the coronary ROIs, which were defined in the same way as the analysis of aortic plaque NIRAF, as described above (NC region from NC plaques, extracellular lipid pool from PIT plaques, calcified nodule/plate from CA plaques, intimal thickening from IH lesions). The histopathologic diagnosis for each NIRAF data point was tabulated. NIRAF intensity data points from the same type of plaques were combined together for comparison. A total of 1200, 1253, 1491, 1554 sites were selected from NC, PIT, CA, and IH regions, respectively. The NIRAF intensity was normalized by the maximum intensity among the selected coronary tissue sites. Differences in normalized NIRAF intensities between all lesion types were analyzed using one-way ANOVA. Differences between two different lesion types were analyzed using a one-tailed Student’s t-test. A p value of less than 0.05 was considered statistically significant.
3. Results
3.1 Bench top NIRAF imaging of aortic plaques
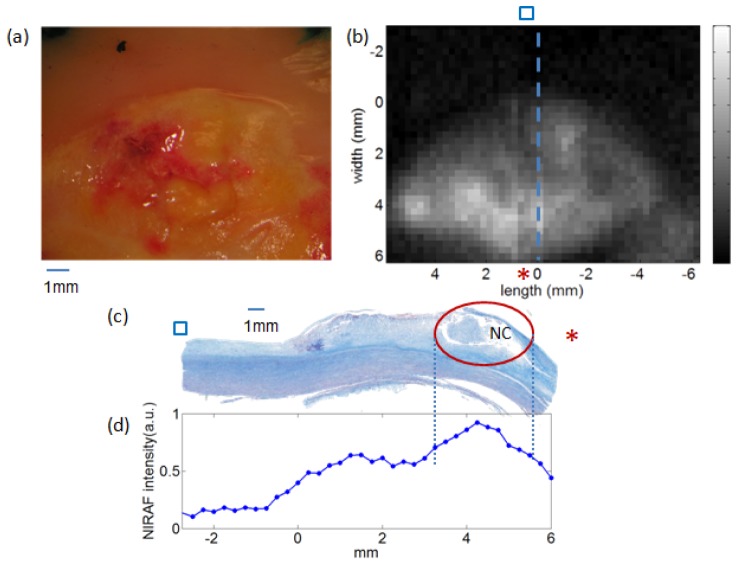
An example of bench top NIRAF images is shown in Fig. 3 . This figure shows the gross pathology (Fig. 3(a)), the NIRAF intensity image (Fig. 3(b)), the Trichrome-stained histology section of a necrotic core plaque (Fig. 3(c)), and the NIRAF intensity profile along the histology section. As can be seen in panels 3b and 3d, the NIRAF signal is elevated over the necrotic core, demarcated by the red circle in Fig. 3(c).
Fig. 3.
Images of a representative human aortic plaque. a) Photo of the plaque measured by NIRAF; b) the NIRAF 2D map of the plaque. The blue dashed line labels the tissue site cut for histology. The blue square and the red asterisk indicate the orientation of the NIRAF image with respect to the histology. c) Corresponding Trichrome-stained cross-sectional histology, taken at the site of the dotted blue line in (b). The red circle in (c) highlights the necrotic core region. d) NIRAF intensity profile along the histology section in (c). The blue dots are the individual NIRAF intensity data points.
Figure 4 shows the comparison of NIRAF intensity among the four types of aortic lesions. One-way ANOVA indicated that there is a statistically significant difference between the NIRAF signal intensity for the different lesion types (p<0.001). Using a Student’s t-test, we compared the mean NIRAF intensity of NC plaque with those from non-necrotic lesions (PIT, CA, IH). The mean NIRAF signals of NC plaque were significantly higher than each of the non-necrotic lesions (PIT, CA, IH) (p<0.001). These findings suggest that NIRAF may be used to differentiate NC plaque from non-necrotic lesions.
Fig. 4.
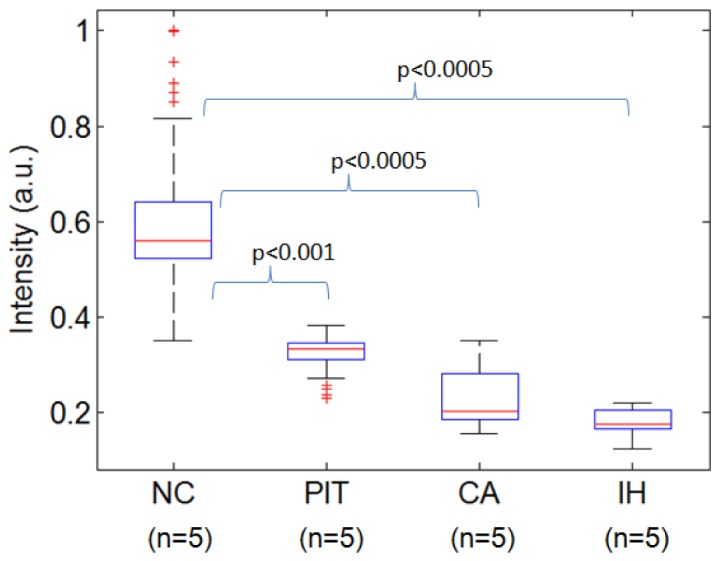
Comparison of NIRAF intensity of diseased sites from different aortic plaque types, excited by 633 nm light. NC – necrotic core, PIT – pathological intimal thickening, CA – calcified plaque, IH – intimal hyperplasia.
The aortic plaque measurements demonstrate the feasibility of detecting NIRAF with a fiber-based DCF catheter. In the next section, we describe the results from catheter-based OCT-NIRAF imaging of human coronary arteries ex vivo.
3.2 OCT-NIRAF catheter based ex vivo imaging
A representative 2-D NIRAF en face intensity map obtained from a coronary artery is shown in Fig. 5 . This artery was a diagonal branch of the left anterior descending artery (LAD), approximately 50mm in length. The x-axis of the 2D NIRAF intensity map corresponds to the longitudinal pullback position, and the y-axis, the scanning angle (i.e., 0 to 360 degrees).
Fig. 5.

NIRAF intensity map from a human cadaver coronary artery (LCx). Dashed line - intimal hyperplasia, Dotted line – calcified plaque. The vertical axis is the imaging angle (0 to 360 degrees) and the horizontal axis is the pullback direction (0 to 50 mm). Image orientation is distal (left side) to proximal (right side) portion of the vessel. The color map ranges from blue (low NIRAF intensity) to green, yellow and white (highest NIRAF intensity).
Composite OCT-NIRAF cross-sectional images and histology from this specimen are shown in Fig. 6 and Fig. 7 . Figure 6(a) shows an OCT-NIRAF image of a region histologically determined to be IH by the means of H&E staining (Fig. 6(c)). The central gray-scale image in Fig. 6(a) is the OCT image, which shows typical IH tissue appearance, and is characterized by a thin layer of homogeneous tissue presenting a low attenuation and a high backscattering coefficient [11]). The colored ring encircling the OCT image represents the co-localized NIRAF signal, which has a low NIRAF intensity (dark blue) and a constant value at the different angular positions for this IH case.
Figure 6(b) shows an OCT-NIRAF image of a calcified plaque. The gray scale OCT image shows a region with a low and heterogeneous OCT signal with sharply delineated borders indicative of a calcium plate [6] from 10 to 5 o’clock, which is confirmed by the corresponding H&E stained slide (Fig. 6(d)). Co-localized NIRAF (Fig. 6(b)) shows that the calcified region has a moderate NIRAF intensity is significantly higher than the remainder of the cross-section, which is primarily comprised of intimal hyperplasia (IH).
Figure 7 shows an OCT-NIRAF image of a pathological intimal thickening plaque. The OCT image in Fig. 7(a) shows signal attenuation from 6 to 9 o’clock, with a diffuse border, indicating a lipid pool, which is confirmed by the corresponding H&E stained slide (Fig. 7(b)). The co-localized NIRAF in Fig. 7(a) shows moderate NIRAF intensity over the lipid-rich intima, while the rest of the cross-section shows a lower signal in areas of intimal hyperplasia (IH).
Figure 8 shows OCT-NIRAF images and corresponding histology from the right coronary artery of another explant heart. The corresponding H&E stained slide (Fig. 8(b)) shows a TCFA with cap rupture. Co-registered OCT-NIRAF images (Fig. 8(a)) show a very high NIRAF signal remitted by the necrotic core plaque. The OCT image (Fig. 8(a)) displays a typical appearance seen in lipid-rich plaques, showing both high backscattering and high attenuation coefficients [6, 11].
Fig. 8.
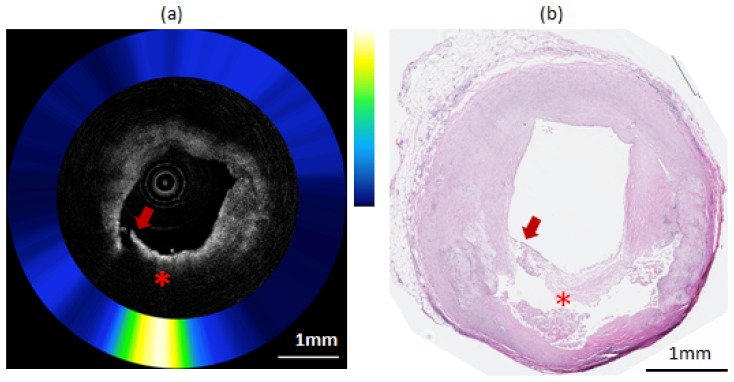
Composite OCT-NIRAF image and corresponding histology for a ruptured necrotic core plaque. a) The OCT image indicates the presence of a plaque rupture (arrow) and area of high attenuation suggestive of a lipid pool or necrotic core (star). The NIRAF signal is high at over the necrotic core location. b) H&E stained slide confirming that this plaque is a ruptured TCFA. The scale bars for both (a) and (b) represent 1mm.
Catheter-based NIRAF signal intensity results for different coronary lesion types are shown in Fig. 9 . The NIRAF intensities from NC, PIT, CA and IH, were statistically significantly different according to one-way ANOVA (p<0.0005). Using a Student’s t-test, the NIRAF intensity of NC plaques was again significantly higher than those from non-necrotic lesions (p<0.0005). The calcified plaques in the coronary arteries showed slightly higher NIRAF than PIT. One possible reason for this finding is that the calcified coronary plaques in this study were advanced and coexisted with significant extracellular lipid. The finding that NIRAF can differentiate NC and non-NC plaques (CA and PIT) in coronary arteries ex vivo is in agreement with the bench top measurement of human aortic plaques, described above. These results indicate that catheter-based OCT-NIRAF may be capable of discriminating coronary NC lesions.
Fig. 9.
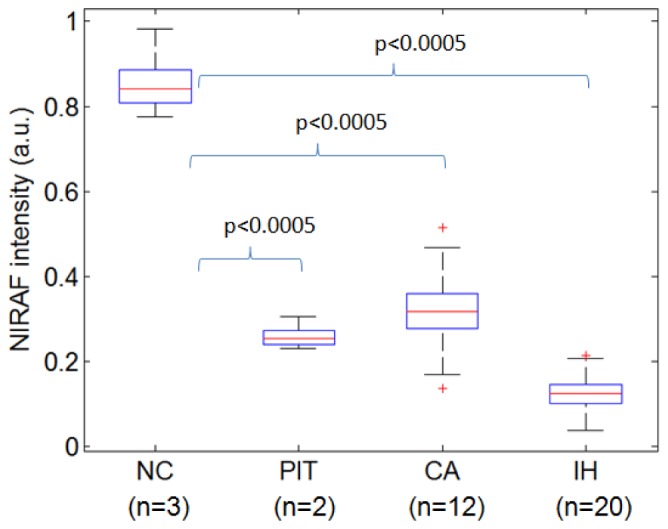
Box plot comparison of NIRAF intensity for different types of coronary lesions. IH - intimal hyperplasia, CA - fibrocalcific, PIT – pathological intimal thickening, NC – necrotic core plaque.
4. Conclusion
In this paper, we have shown that NIRAF excited at 633 nm with emission collected between 675 and 950 nm is significantly higher in necrotic core lesions than other plaque types ex vivo. We have demonstrated that NIRAF can be collected using the cladding of a DCF and OCT can be performed through the single-mode core, making it possible to construct OCT-NIRAF catheters for imaging coronary arteries. Finally, we have shown that multimodality OCT-NIRAF system and catheters can be used to image human coronary arteries ex vivo, providing complementary information that can potentially improve the diagnostic accuracy for detecting necrotic core lesions during intracoronary imaging. Future work will be focused on identifying the molecular source of this NIRAF signal and conducting intracoronary OCT-NIRAF in human patients.
Disclosures
Massachusetts General Hospital has a licensing arrangement with Terumo Corporation. Dr. Tearney has the rights to receive royalties from this licensing arrangement. Dr. Tearney receives sponsored research from Canon Inc. and Infraredx.
Acknowledgments
Research reported in this publication was supported by the National Heart, Lung and Blood Institute of the National Institutes of Health under award number R01HL093717. The content is solely the responsibility of the authors and does not necessarily represent the official views of the National Institutes of Health. We also would like to acknowledge Nufern Corporation for assisting us with the double-clad fibers used in this project.
References and links
- 1.Murphy S. L. X., Kochanek J., Kenneth D., “Deaths: Final Data for 2010,” Natl. Vital Stat. Rep. (2013). [PubMed]
- 2.Go A. S., Mozaffarian D., Roger V. L., Benjamin E. J., Berry J. D., Blaha M. J., Dai S., Ford E. S., Fox C. S., Franco S., Fullerton H. J., Gillespie C., Hailpern S. M., Heit J. A., Howard V. J., Huffman M. D., Judd S. E., Kissela B. M., Kittner S. J., Lackland D. T., Lichtman J. H., Lisabeth L. D., Mackey R. H., Magid D. J., Marcus G. M., Marelli A., Matchar D. B., McGuire D. K., Mohler E. R., Moy C. S., Mussolino M. E., Neumar R. W., Nichol G., Pandey D. K., Paynter N. P., Reeves M. J., Sorlie P. D., Stein J., Towfighi A., Turan T. N., Virani S. S., Wong N. D., Woo D., Turner M. B., “Heart disease and stroke statistics—2014 update: A report from the American Heart Association,” Circulation 127(1), e6–e245 (2013). 10.1161/CIR.0b013e31828124ad [DOI] [PMC free article] [PubMed] [Google Scholar]
- 3.Virmani R., Burke A. P., Farb A., Kolodgie F. D., “Pathology of the vulnerable plaque,” J. Am. Coll. Cardiol. 47(8Suppl), C13–C18 (2006). 10.1016/j.jacc.2005.10.065 [DOI] [PubMed] [Google Scholar]
- 4.Chow B. J. W., Abraham A., Wells G. A., Chen L., Ruddy T. D., Yam Y., Govas N., Galbraith P. D., Dennie C., Beanlands R. S., “Diagnostic accuracy and impact of computed tomographic coronary angiography on utilization of invasive coronary angiography,” Circ Cardiovasc Imaging 2(1), 16–23 (2009). 10.1161/CIRCIMAGING.108.792572 [DOI] [PubMed] [Google Scholar]
- 5.Tearney G. J. M. D. P., Yabushita H. M. D., Houser S. L. M. D., Aretz H. T. M. D., Jang I.-K. M. D., Schlendorf K. H. B. S., Kauffman C. R. B. S., Shishkov M. P., Halpern E. F. P., Bouma B. E. P., “Quantification of macrophage content in atherosclerotic plaques by optical coherence tomography,” Circulation 107(1), 113–119 (2003). 10.1161/01.CIR.0000044384.41037.43 [DOI] [PubMed] [Google Scholar]
- 6.Jang I.-K., Bouma B. E., Kang D.-H., Park S.-J., Park S.-W., Seung K.-B., Choi K.-B., Shishkov M., Schlendorf K., Pomerantsev E., Houser S. L., Aretz H. T., Tearney G. J., “Visualization of coronary atherosclerotic plaques in patients using optical coherence tomography: comparison with intravascular ultrasound,” J. Am. Coll. Cardiol. 39(4), 604–609 (2002). 10.1016/S0735-1097(01)01799-5 [DOI] [PubMed] [Google Scholar]
- 7.Yabushita H., Bouma B. E., Houser S. L., Aretz H. T., Jang I.-K., Schlendorf K. H., Kauffman C. R., Shishkov M., Kang D.-H., Halpern E. F., Tearney G. J., “Characterization of Human Atherosclerosis by Optical Coherence Tomography,” Circulation 106(13), 1640–1645 (2002). 10.1161/01.CIR.0000029927.92825.F6 [DOI] [PubMed] [Google Scholar]
- 8.Tearney G. J., Waxman S., Shishkov M., Vakoc B. J., Suter M. J., Freilich M. I., Desjardins A. E., Oh W.-Y., Bartlett L. A., Rosenberg M., Bouma B. E., “Three-dimensional coronary artery microscopy by intracoronary optical frequency domain imaging,” JACC Cardiovasc. Imaging 1(6), 752–761 (2008). 10.1016/j.jcmg.2008.06.007 [DOI] [PMC free article] [PubMed] [Google Scholar]
- 9.Tearney G. J., Regar E., Akasaka T., Adriaenssens T., Barlis P., Bezerra H. G., Bouma B., Bruining N., Cho J. M., Chowdhary S., Costa M. A., de Silva R., Dijkstra J., Di Mario C., Dudek D., Falk E., Feldman M. D., Fitzgerald P., Garcia-Garcia H. M., Gonzalo N., Granada J. F., Guagliumi G., Holm N. R., Honda Y., Ikeno F., Kawasaki M., Kochman J., Koltowski L., Kubo T., Kume T., Kyono H., Lam C. C. S., Lamouche G., Lee D. P., Leon M. B., Maehara A., Manfrini O., Mintz G. S., Mizuno K., Morel M. A., Nadkarni S., Okura H., Otake H., Pietrasik A., Prati F., Räber L., Radu M. D., Rieber J., Riga M., Rollins A., Rosenberg M., Sirbu V., Serruys P. W. J. C., Shimada K., Shinke T., Shite J., Siegel E., Sonoda S., Suter M., Takarada S., Tanaka A., Terashima M., Thim T., Uemura S., Ughi G. J., van Beusekom H. M. M., van der Steen A. F. W., van Es G.-A., van Soest G., Virmani R., Waxman S., Weissman N. J., Weisz G., International Working Group for Intravascular Optical Coherence Tomography (IWG-IVOCT) , “Consensus standards for acquisition, measurement, and reporting of intravascular optical coherence tomography studies: a report from the international working group for intravascular optical coherence tomography standardization and validation,” J. Am. Coll. Cardiol. 59(12), 1058–1072 (2012). 10.1016/j.jacc.2011.09.079 [DOI] [PubMed] [Google Scholar]
- 10.Brezinski M. E., “Current capabilities and challenges for optical coherence tomography as a high-impact cardiovascular imaging modality,” Circulation 123(25), 2913–2915 (2011). 10.1161/CIRCULATIONAHA.111.034272 [DOI] [PMC free article] [PubMed] [Google Scholar]
- 11.Xu C., Schmitt J. M., Carlier S. G., Virmani R., “Characterization of atherosclerosis plaques by measuring both backscattering and attenuation coefficients in optical coherence tomography,” J. Biomed. Opt. 13(3), 034003 (2008). 10.1117/1.2927464 [DOI] [PubMed] [Google Scholar]
- 12.van Soest G., Goderie T., Regar E., Koljenović S., van Leenders G. L., Gonzalo N., van Noorden S., Okamura T., Bouma B. E., Tearney G. J., Oosterhuis J. W., Serruys P. W., van der Steen A. F., “Atherosclerotic tissue characterization in vivo by optical coherence tomography attenuation imaging,” J. Biomed. Opt. 15(1), 011105 (2010). 10.1117/1.3280271 [DOI] [PubMed] [Google Scholar]
- 13.van Soest G., Regar E., Goderie T. P. M., Gonzalo N., Koljenović S., van Leenders G. J. L. H., Serruys P. W., van der Steen A. F. W., “Pitfalls in plaque characterization by OCT: image artifacts in native coronary arteries,” JACC Cardiovasc. Imaging 4(7), 810–813 (2011). 10.1016/j.jcmg.2011.01.022 [DOI] [PubMed] [Google Scholar]
- 14.Monici M., El-Gewely M. R., “Cell and tissue autofluorescence research and diagnostic applications,” in Biotechnology Annual Review(Elsevier, 2005), pp. 227–256. [DOI] [PubMed] [Google Scholar]
- 15.Baraga J. J., Rava R. P., Taroni P., Kittrell C., Fitzmaurice M., Feld M. S., “Laser induced fluorescence spectroscopy of normal and atherosclerotic human aorta using 306-310 nm excitation,” Lasers Surg. Med. 10(3), 245–261 (1990). 10.1002/lsm.1900100305 [DOI] [PubMed] [Google Scholar]
- 16.Angheloiu G. O., Arendt J. T., Müller M. G., Haka A. S., Georgakoudi I., Motz J. T., Scepanovic O. R., Kuban B. D., Myles J., Miller F., Podrez E. A., Fitzmaurice M., Kramer J. R., Feld M. S., “Intrinsic Fluorescence and Diffuse Reflectance Spectroscopy Identify Superficial Foam Cells in Coronary Plaques Prone to Erosion,” Arterioscler. Thromb. Vasc. Biol. 26(7), 1594–1600 (2006). 10.1161/01.ATV.0000225699.36212.23 [DOI] [PubMed] [Google Scholar]
- 17.Marcu L., “Fluorescence lifetime in cardiovascular diagnostics,” J. Biomed. Opt. 15(1), 011106 (2010). 10.1117/1.3327279 [DOI] [PMC free article] [PubMed] [Google Scholar]
- 18.Gardner C. M., Jacques S. L., Welch A. J., “Fluorescence spectroscopy of tissue: recovery of intrinsic fluorescence from measured fluorescence,” Appl. Opt. 35(10), 1780–1792 (1996). 10.1364/AO.35.001780 [DOI] [PubMed] [Google Scholar]
- 19.Laifer L. I., O’Brien K. M., Stetz M. L., Gindi G. R., Garrand T. J., Deckelbaum L. I., “Biochemical basis for the difference between normal and atherosclerotic arterial fluorescence,” Circulation 80(6), 1893–1901 (1989). 10.1161/01.CIR.80.6.1893 [DOI] [PubMed] [Google Scholar]
- 20.Gardecki J. A., Chau A., Tearney G., “Report on ex vivo Raman database studies,” (Prescient Medical Inc. and The General Hospital Corporation, Boston,MA, 2009). [Google Scholar]
- 21.Choma M. A., Hsu K., Izatt J. A., “Swept source optical coherence tomography using an all-fiber 1300‐nm ring laser source,” J. Biomed. Opt. 10, 044009 (2005). [DOI] [PubMed] [Google Scholar]
- 22.Yoo H., Kim J. W., Shishkov M., Namati E., Morse T., Shubochkin R., McCarthy J. R., Ntziachristos V., Bouma B. E., Jaffer F. A., Tearney G. J., “Intra-arterial catheter for simultaneous microstructural and molecular imaging in vivo,” Nat. Med. 17(12), 1680–1684 (2011). 10.1038/nm.2555 [DOI] [PMC free article] [PubMed] [Google Scholar]
- 23.Ughi G. J., Verjans J., Fard A. M., Wang H., Osborn E., Hara T., Mauskapf A., Jaffer F. A., Tearney G. J., “Dual modality intravascular optical coherence tomography (OCT) and near-infrared fluorescence (NIRF) imaging: a fully automated algorithm for the distance-calibration of NIRF signal intensity for quantitative molecular imaging,” Int. J. Cardiovasc. Imaging 31, 259–268 (2014). 10.1007/s10554-014-0556-z [DOI] [PMC free article] [PubMed] [Google Scholar]


