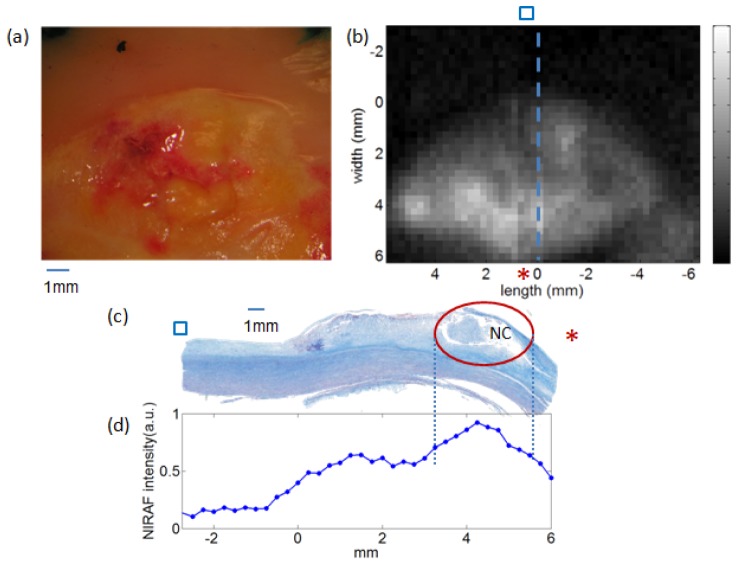
Fig. 3.
Images of a representative human aortic plaque. a) Photo of the plaque measured by NIRAF; b) the NIRAF 2D map of the plaque. The blue dashed line labels the tissue site cut for histology. The blue square and the red asterisk indicate the orientation of the NIRAF image with respect to the histology. c) Corresponding Trichrome-stained cross-sectional histology, taken at the site of the dotted blue line in (b). The red circle in (c) highlights the necrotic core region. d) NIRAF intensity profile along the histology section in (c). The blue dots are the individual NIRAF intensity data points.

