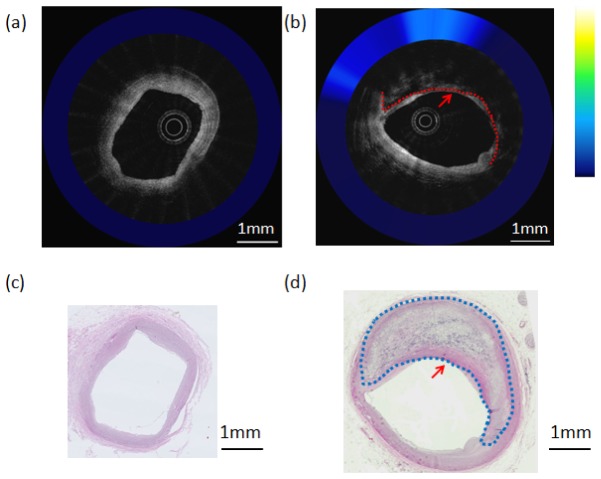
Fig. 6.
OCT-NIRAF composite images and corresponding H&E stained slides. a) OCT-NIRAF image of neointimal hyperplasia; taken at the location of the dashed line in Fig. 5; b) OCT-NIRAF image of a fibrocalcific plaque, taken at the location of the dotted line in Fig. 5. The red dotted line delineates the calcified region on OCT. c) Corresponding H&E stained slide for the OCT-NIRAF image in (a) showing intimal hyperplasia; d) Corresponding H&E stained slide for OCT-NIRAF image in (b), showing a fibrocalcific lesions. The dotted lines in (b) and (d) outline the region of calcification in the fibrocalcific plaque. Scale bars represent 1 mm. The arrows in (b) and (d) point to regions where the calcification abuts the luminal surface.

