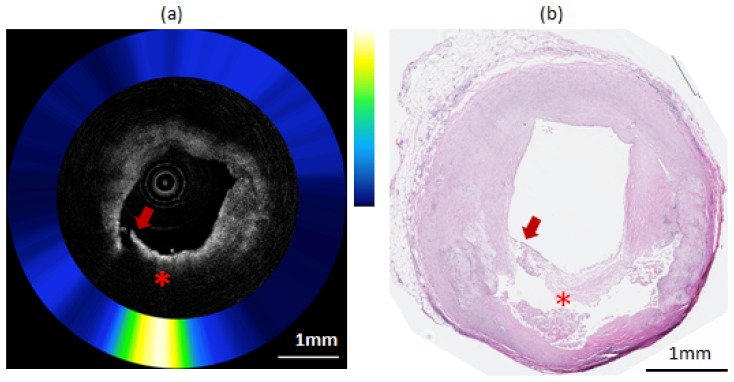
Fig. 8.

Composite OCT-NIRAF image and corresponding histology for a ruptured necrotic core plaque. a) The OCT image indicates the presence of a plaque rupture (arrow) and area of high attenuation suggestive of a lipid pool or necrotic core (star). The NIRAF signal is high at over the necrotic core location. b) H&E stained slide confirming that this plaque is a ruptured TCFA. The scale bars for both (a) and (b) represent 1mm.
