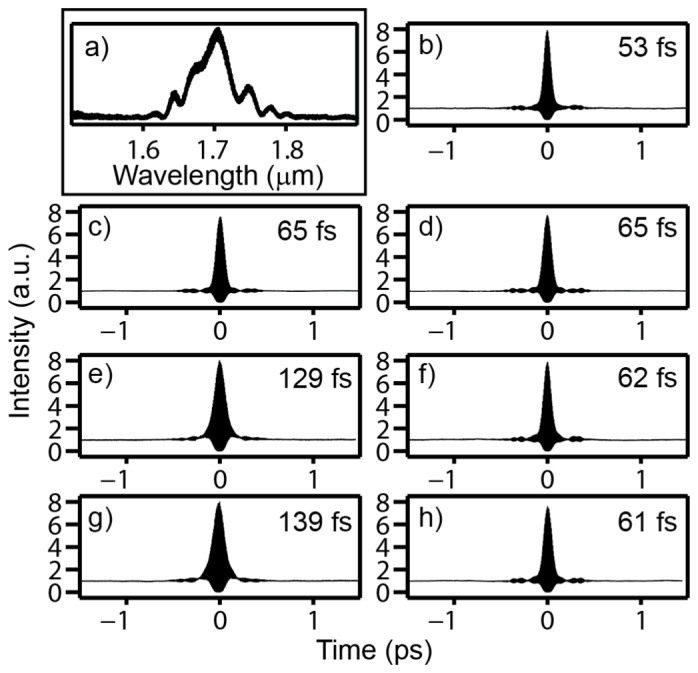
Fig. 3.

Spectrum of pulse and second-order interferometric autocorrelations after various optical elements. (a) Pulse spectrum after the PC rod. (b)-(h) Second-order interferometric autocorrelations: (b) immediately after the collimating lens following the PC rod, (c) after 2 mm H2O, (d) after 1 cm D2O, (e) after microscope and 1 mm H2O, (f) after microscope, 1 mm H2O, and 3 mm Si, (g) after microscope and 2 mm H2O, (h) after microscope, 2 mm H2O, and 3 mm Si. The intensity FWHM of the pulse, assuming a sech2 pulse, is also displayed in each panel.
