
Fig. 2.
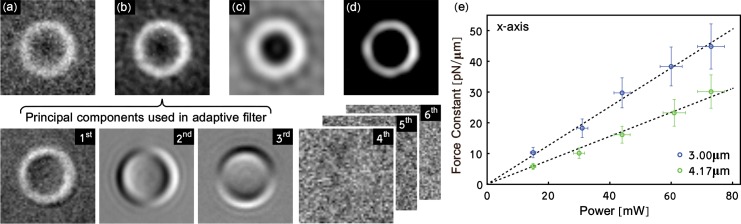
Illustration of the image filtering process and force characterization. (a) shows an original frame from a movie of a 3.00μm diameter bead trapped with 60mW. (b) shows the same frame as in (a) after application of the adaptive filter. The bottom row of images shows the first six PCs for the movie of which the first three are used in the adaptive filter. In this example, all PCs after the third contain only random noise. In (c) an additional bandpass filter has removed dead pixels and other small stationary objects. (d) shows the thresholded image, used for tracking. (e) shows force constants as a function of laser power along the x-axis for 3.00 and 4.17μm diameter polystyrene beads. The force constants have a power dependence given by fx,3.00μm = (0.63±0.01)pN · μm−1 ·mW−1, and fx,4.17μm = (0.39±0.01)pN · μm−1 · mW−1 for the x-axis, for 3.00 and 4.17μm diameter beads respectively. Similar trends, fy,3.00μm = (0.522 ± 0.006)pN · μm−1 · mW−1, and fy,4.17μm = (0.35 ± 0.006)pN · μm−1 · mW−1 were determined for the y-axis.