
Fig. 6.
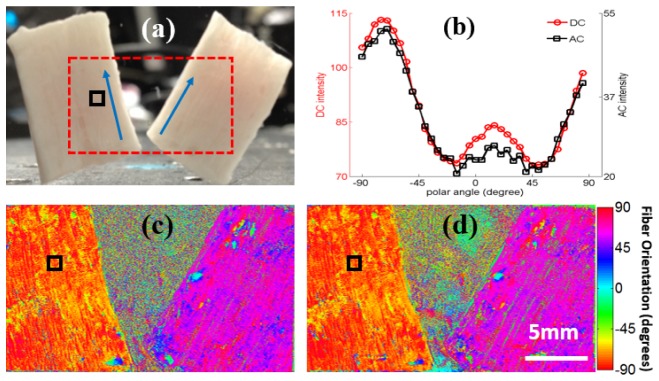
Collagen fiber orientation mapping on bovine tendons. (a) Blue arrows indicate the gross fiber orientation of the bovine tendons. Red rectangle shows the imaged area. (b) Back-scattered intensity plot over a small region indicated by a black square using both DC and AC components. (c) Fiber orientation map extracted using on AC components. (d) Fiber orientation map extracted using DC component.