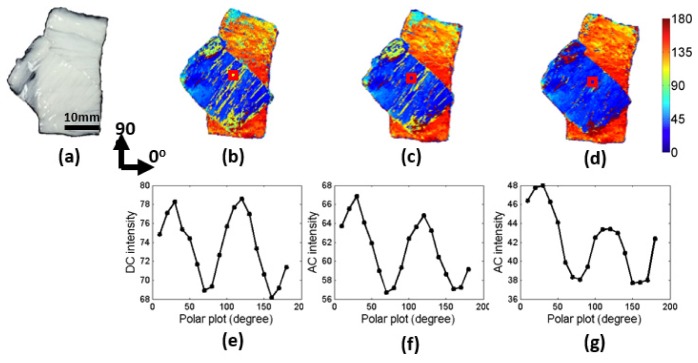
Fig. 7.

Depth controlled pSFDI imaging of a two-layer bovine tendon sample (a). The collagen fiber orientation map retrieved using polarized light imaging without spatial pattern in map (b). The collagen fiber orientation maps (c) and (d) retrieved at spatial frequencies 0.09 and 0.5 mm-1, respectively. The intensity plot (e-g) for localized regions in (b-d), respectively.
