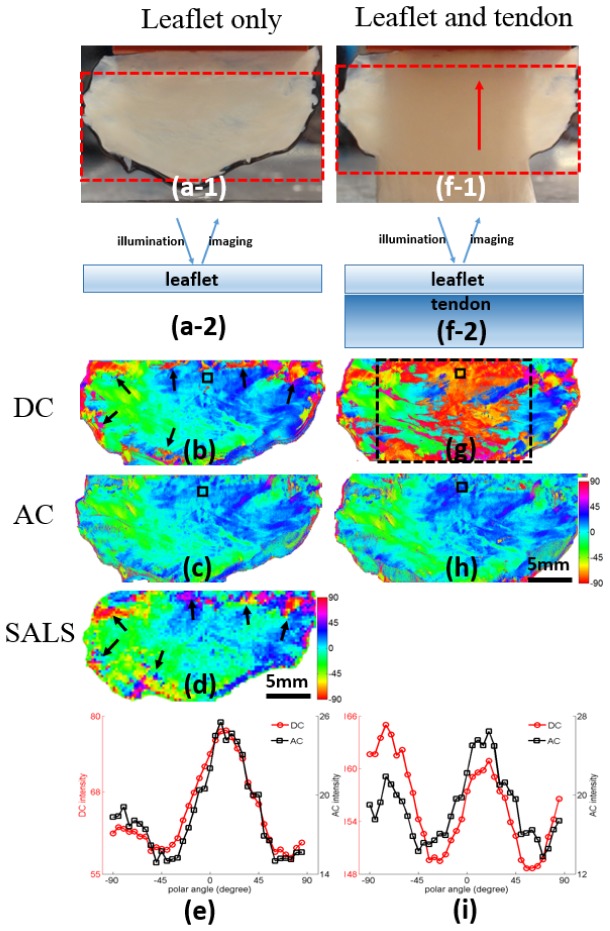
Fig. 8.
pSFDI imaing on PVL (a-1 and 2) and PLV-tendon combination (f-1 and 2). DC component based fiber orientaion maps (b and g) for PLV and PLV-tendon combination, respectively. AC component based fiber orientation maps (c and h) for PLV and PLV-tendon combination, respectively. A SALS based orientation map (d) for PLV was obtained for comparison purpose. Polar plots of both AC and DC components from a small region indicated by black sqares (b and g) for both PLV (e) and PLV-tendon combination (i) respectively. Black arrows in (b) and (d) indicate unreliable fiber orientation. Dashed black rectangle in (g) indicates the overlapping region of PLV-tendon combination.

