
Figure 1. Oscillators in constant darkness demonstrate gradual desynchrony over time, whereas oscillators exposed to a white light pulse at CT 22 show synchrony phase retuning.
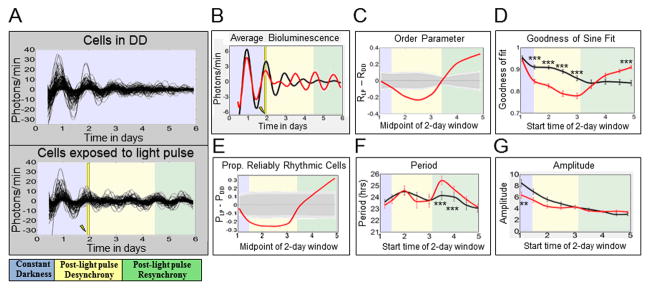
Neuronal oscillators were either maintained in constant darkness (‘DD cells’) or exposed to a 15 min 12.57 W/m2 (2,000 lux) light pulse at CT 22 on the second day in DD (‘LP cells’). The time at which the light pulse (LP) is applied is indicated by a yellow bar and lightning bolt. The colored-backgrounds provide general time frames of significant changes in order parameter. Bluish-gray indicates pre-LP application, yellow indicates post-LP desynchrony, and green indicates resynchrony. A: XLG-Per-Luc bioluminescence time-series measurements show that LP cells (lower panel; n=126) exhibit transient loss then recovery and even strengthening of cell synchrony over time compared to DD cells (upper panel; n=122), which exhibit a gradual, monotonic loss of cell synchrony. B: Comparing averaged bioluminescence traces confirms that LP cells (red line) exhibit an acute decrease in synchronized rhythmicity after the light pulse followed by recovery and eventual strengthening of synchronized rhythmicity relative to DD cells (black line). C: After a LP, oscillators display significant reduction in the order parameter R followed by a delayed significant increase in R. The order parameter R varies between 0 and 1, with higher values indicating similarity in phase, period, and waveform. The solid red curve represents the difference in R between LP and DD cells (RLP – RDD). The dark and light gray zones indicate the 95% and 99% confidence zones, respectively. The null hypothesis is that there is no difference between LP and DD values of R, as determined using 10,000 bootstrap samples (details in “Experimental Procedures”). D: Using oscillator goodness-of-sine-fit (g.o.f.) as a measure of rhythmicity, it was found that after a LP, cells (red line) demonstrate an acute reduction in g.o.f. followed by significantly greater g.o.f. over time as compared to DD oscillators at corresponding time points (black line). E: After a LP, relative to DD, there is a significant transient decrease in the proportion of reliably rhythmic cells (‘P’), followed by a significant increase in ‘P’ over time. The solid red line indicates the difference between LP and DD conditions (PLP – PDD). Cells with g.o.f. ≥ 0.82 are considered to be “reliably rhythmic.” The dark and light gray zones indicate 95% and 99% confidence zones as described in C. F: Sine-fit estimates of period indicate that LP cells (red line) exhibit a transient increase in period length several days after a light pulse. It should be noted that sine-fit estimates of period at these time points may be unreliable due to low amplitude oscillations following the light pulse. G: Sine-fit estimates of amplitude indicate that that LP cells (red lines) exhibit no significant differences in amplitude following exposure to the LP when compared to DD cells at corresponding time points. The difference in amplitude for the first 2-day window time point is likely due to slight overlap with changes in amplitude induced by the light pulse at 1.92 days. The error bars for g.o.f., period and amplitude represent ± SEM with significance analyzed using one-way ANOVA, Tukey post hoc test. *** indicates P<0.001 and ** indicates P<0.005.