


Figure 2. Exposure of cultured brain explants to a light pulse reveals qualitatively distinct dynamic signatures of neuronal subgroups.
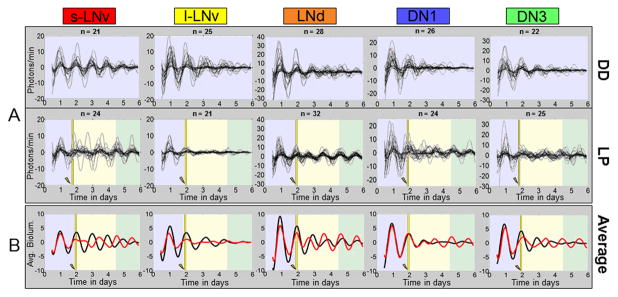
A: Single neuron oscillations are shown separately for each neuronal subgroup. Top: Neuron subgroups maintained in DD showing a general loss of intra-subgroup synchrony and amplitude over time. S-LNvs exhibit the most robust rhythms over time. Bottom: Neuron subgroups exposed to a 15 minute 12.57 W/m2 light pulse at CT 22 of the second day in DD ex vivo. LP induced transient phase tumbling followed by synchrony phase retuning is seen qualitatively at varying degrees for all groups except the l-LNv which rapidly lose oscillator synchrony and amplitude and do not phase retune following the LP by the end of the recording. Conversely, LNds do not appear to exhibit any significant loss of synchrony following the LP. The number of cells analyzed for each group is indicated by “n.” The background color coding is the same as in Fig. 2. B: Averaged bioluminescence traces for LP (red line) vs. DD (black line) oscillators sharpen the qualitative patterns seen in the individual oscillator records.