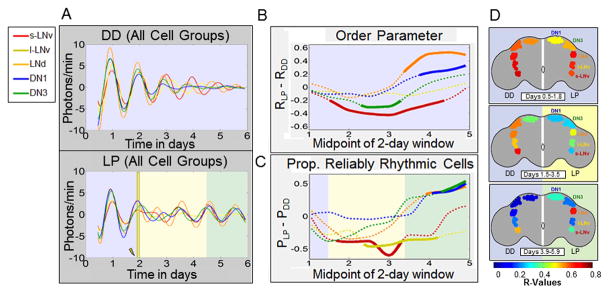
Figure 4. Alignment of neuronal subgroup responses to a LP reveals temporally distinct kinetic signatures of phase retuning.

In A–C, plots of neuronal subgroup data are coded by color: s-LNv (red), l-LNv (yellow), LNd (orange), DN1 (blue) and DN3 (green). A (Top): Average bioluminescence traces for subgroups maintained in DD exhibit a progressive and monotonic loss of rhythmicity and inter-subgroup synchrony over time. A (Bottom): After a light pulse (LP), average bioluminescence traces for subgroups exhibit a transient reduction in rhythmic amplitude and inter-subgroup synchrony, followed by a general strengthening of rhythmic amplitude and inter-subgroup synchrony over time relative to corresponding neurons in DD. B, C: Inter-subgroup comparisons of averaged single neuron circadian parameters measured using 2 day sliding windows. B: After a LP, s-LNvs exhibit the first and longest lasting significant reduction in R, with DN3s exhibiting similar but less extreme changes. LNds and DN1s subsequently show significant strengthening of synchrony, coinciding with recovery of s-LNv synchrony. Dotted lines indicate no significant changes in synchrony after a light pulse relative to DD (RLP – RDD) while solid lines indicate significance outside the 99% confidence interval determined by bootstrapping. C: Inter-subgroup comparisons of the relative proportion of reliably rhythmic cells (PLP – PDD) show that the s-LNvs and l-LNvs exhibit significant initial decreases in proportion of rhythmic cells after exposure to a light pulse, whereas the DN1, DN3 and LNd exhibit a significant delayed increase. Dotted and solid lines indicate lack or presence of statistically significant differences between LP and DD conditions as shown above for R. D: Images of selected time points from Movie S2 comparing inter-subgroup differences in kinetics of changes in synchrony in DD or with the light pulse. The pseudocolor heat map codes values of R, with warm colors indicating high synchrony among cells within a subgroup. Left sides of brains show DD, right sides show response to LP. The colored backgrounds designating general time frames of significant changes in R are the same as previous figures.
