
Figure 1.
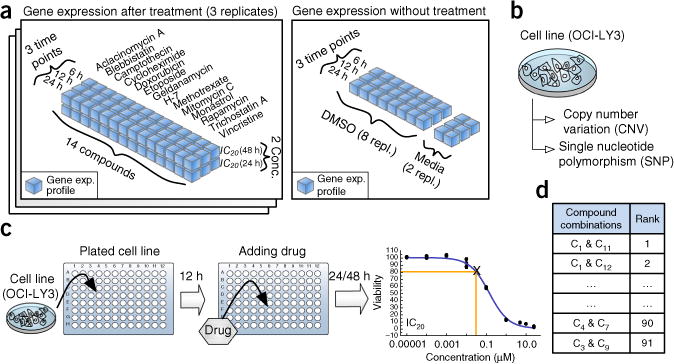
Overview of data sets used in the NCI-DREAM compound-pair activity challenge. (a) Gene expression profiles of baseline samples, DMSO-treated and 14 single compound–treated samples are generated at three different time points (6, 12 and 24 h) and two different compound concentrations (IC20 at 24 and 48 h, where IC20 is defined as the compound concentration that kills 20% of cells). Compound-treated samples were generated in triplicate, baseline samples in duplicate and DMSO-treated samples in octuplicate. (b) The baseline genetic profile of the OCI-LY3 cell line obtained previously18 was provided to the participants. (c) Participants were also provided with the dose-response curve following single treatment. The curves were derived from a single-agent treatment of OCI-LY3 for the indicated time. X represents IC20 concentration of a compound. (d) Participants were required to rank each of the 91 pairwise compound combinations of 14 compounds from the most synergistic to the most antagonistic. Any additional data derived by participants through analysis of the literature were considered admissible in the challenge. Assays to experimentally test compound synergy, even in a limited format, were expressly prohibited.