
Figure 4.
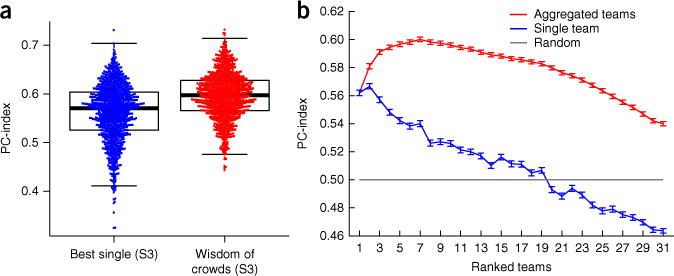
Community predictions. (a) Bee Swarm plot showing the performance of ensemble models and single best model, inferred from over 1,000 different three-set splits (S1/S2/S3) of the 91 drug pairs in the challenge. The first set S1 was used to determine an order of performance. The second set S2 was used to choose the optimal number of top methods to aggregate to attain best performance of the aggregate. Finally, the last set S3, which was not used to choose the order of aggregation or the optimal number of predictions to aggregate, was used to determine the performance of the best method (according to set S1) and of the “wisdom of crowds” aggregate. The latter is consistently better than the former. (b) Average and standard error over the 1,000 splits shown in a of the PC-index as computed in set S3 of individual teams (blue) and aggregates of the top-performing teams (red). The order of the teams in the x axis was determined according to set S1, but the performance was evaluated in set S3. The gray solid line represents random performance. Error bar represents the s.e.m. of the PC-index.