
Figure 5.
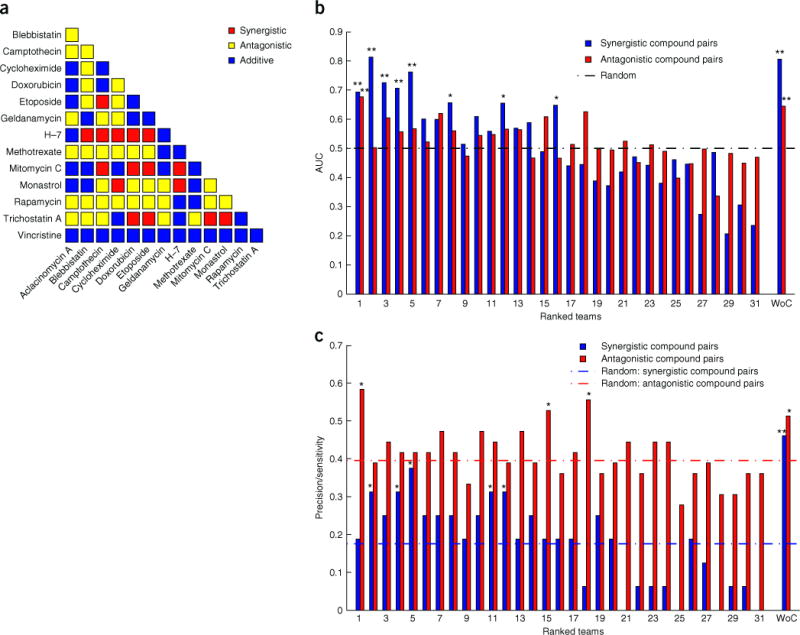
Synergistic and antagonistic gold standard and predictions. (a) Activity of compound pairs after discretizing the gold standard data into three states based on signal-to-noise ratio for excess over Bliss. Red, synergistic; yellow, additive; blue, antagonistic. (b) Area under the ROC (AUC) for synergistic (red) and antagonistic (blue) compound pairs. Teams are ranked by their performance in the challenge. WoC, performance of the “wisdom of crowds.” Black horizontal dashed line shows the average performance of random predictions. *FDR ≤ 0.20; **FDR ≤ 0.05. (c) Precision and sensitivity for synergistic (red) and antagonistic (blue) compound pairs. Horizontal dashed line in red and blue shows random performance for synergistic and antagonistic compound pairs, respectively. WoC, performance of the “wisdom of crowds.” Teams are ranked by their performance in the challenge. *P ≤ 0.05; **FDR ≤ 0.20.