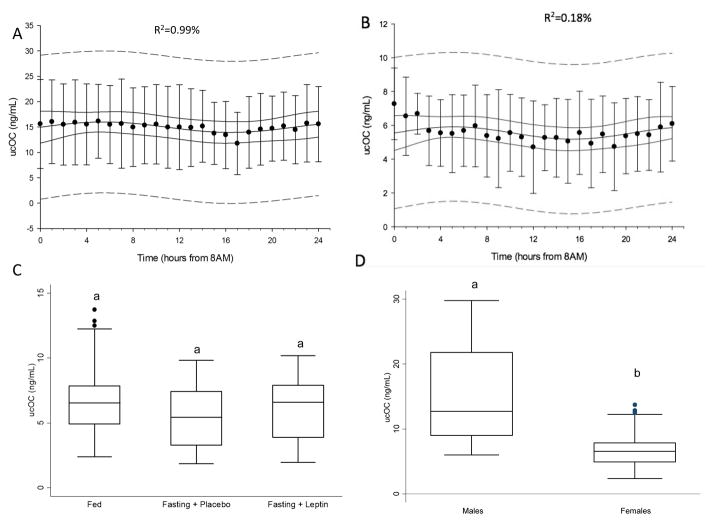
Figure 1.
A. Mean undercarboxylated osteocalcin (ucOC) levels (ng/mL) in the fed state demonstrating absence of day/night variation in males (n=6). Adjusted R2 is displayed at the top center. Solid line represents 95% confidence interval, interrupted line represents 95% prediction interval; B. Mean undercarboxylated osteocalcin (ucOC) levels (ng/mL) in the fed state demonstrating absence of day/night variation in females (n=6). Adjusted R2 is displayed at the top center. Solid line represents 95% confidence interval, interrupted line represents 95% prediction interval; C. Box plots of ucOC levels in all three states in females, demonstrating no change in levels in response to fasting and leptin replacement; no statistical significant difference was detected at the 0.05 level (n=6); D. Box plots of ucOC levels in fed state, signifying higher levels in males compared to females, different letters signify statistically significant difference at the 0.05 level.

