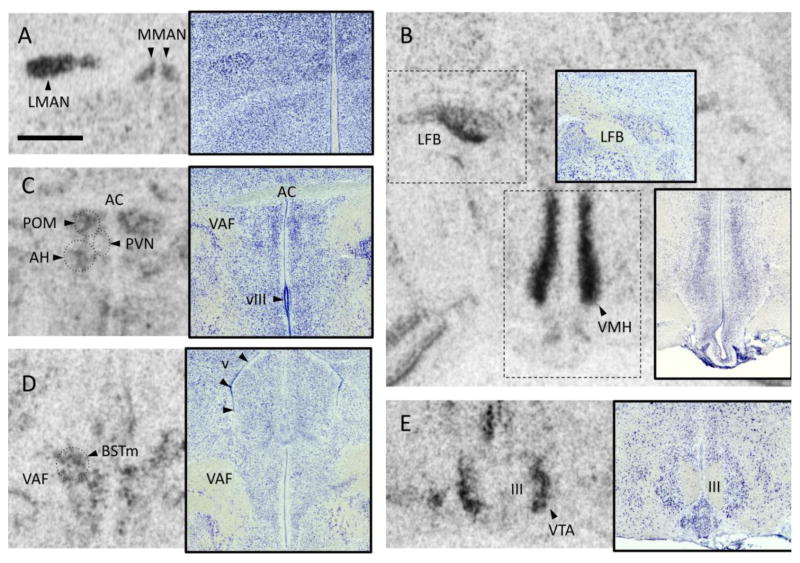
Fig. 1.
Examples of VT1 receptor mRNA labeling quantified in this study. Each panel shows a film autoradiogram along with an inset depicting a Nissl-stained alternate section from the same animal. All photos are from a T-treated male. Scale bar in A, 1mm, applies to all images. A. Medial and lateral portions of the magnocellular nucleus of the anterior nidopallium (MMAN and LMAN). The midline can be seen to the right. B. A cell group intermingled with fibers of the lateral forebrain bundle (LFB) is heavily labeled, as is the ventromedial hypothalamus (VMH). C. The dorsal hypothalamus showing the caudal portion of the medial preoptic area (POM), the paraventricular nucleus (PVN; seen in the Nissl stain), and the anterior hypothalamus (AH). The anterior commissure (AC) can be seen along the top of the photo and the third ventricle (vIII) at the bottom. The dotted circles show the approximate areas sampled for each region of interest. D. The medial portion of the bed nucleus of the stria terminalis (BSTm) as it appears just caudal to the AC, medial to the ventral amygdalofugal tract (VAF) and ventral to the lateral ventricle (v). The dotted circle shows the approximate area sampled. E. The ventral tegmental area (VTA) is seen on either side of the oculomotor nerve (III) as it exits the base of the brain.

