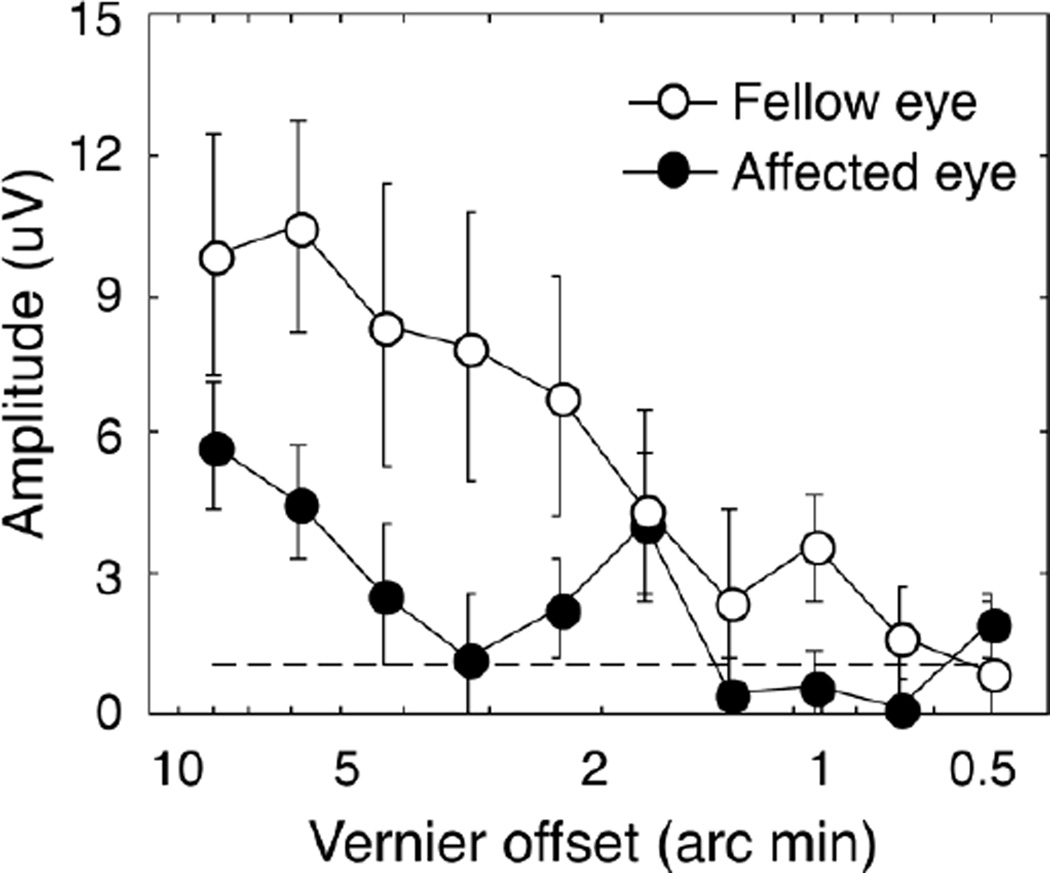
Figure 3. Average of sweep VEP signal responses for 4 children with orbital vascular birthmarks that caused intermittent occlusion of the visual axis.
Vector-averaged responses of first harmonics (1f1) at Oz derivation across 4 patients for affected eyes (filled circles) and fellow eyes (open circles). Error bars plot SEMs. The dash line shows the noise level of the EEG. Response amplitudes were diminished in the affected eyes compared with the fellow eyes.

