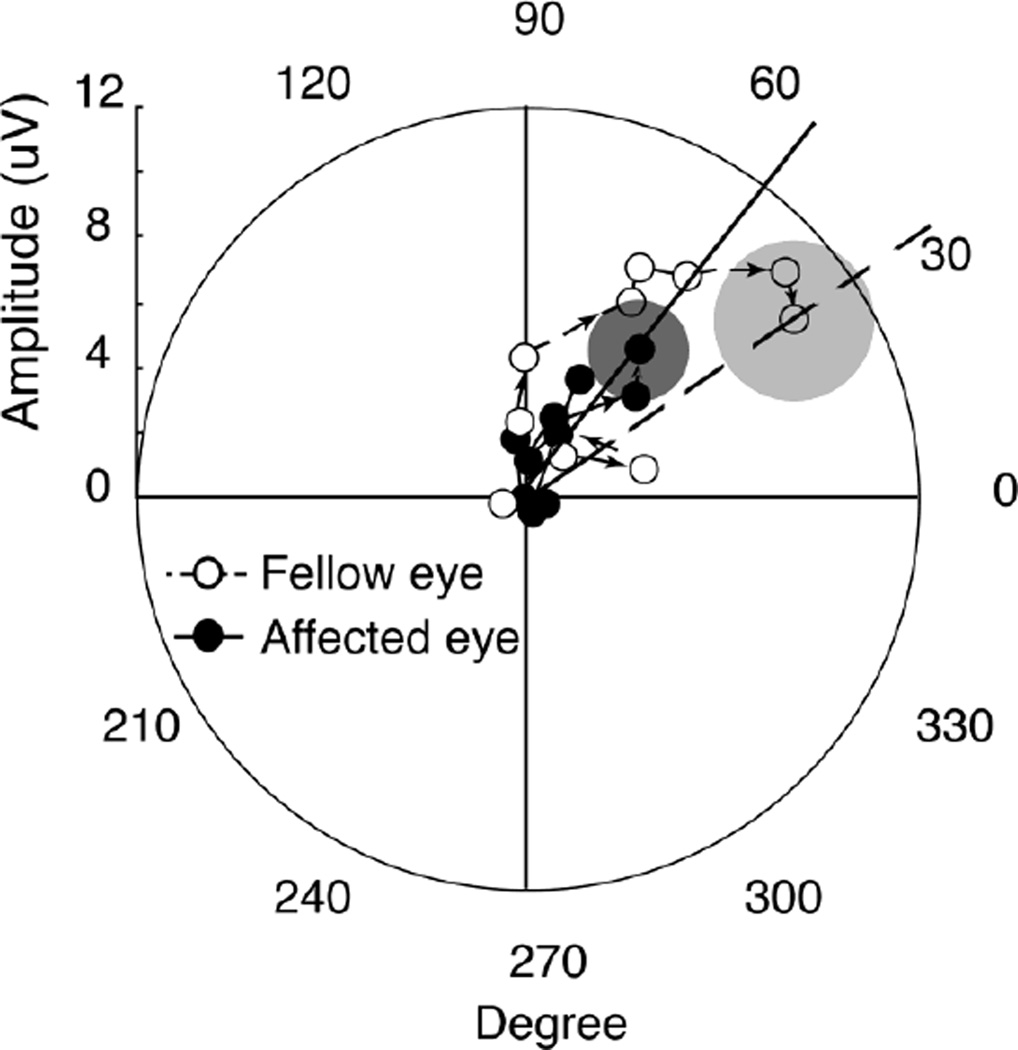
Figure 4. Polar plot showing amplitude and phase of responses for 4 children with orbital vascular birthmarks.
Polar plot of the amplitude and phase of the first harmonic response at Oz derivation in affected eyes (filled circles) and fellow eyes (open circles) are shown. Arrows indicate the direction of increasing vernier offsets; i.e., moving radially from the center and out increases the visibility of the offsets. The circles plot +/−1 SEM of the vector mean for the largest vernier offset (8 arc min). Lines indicate the phase at the largest vernier offset in affected eyes (solid line) and fellow eyes (dashed line). The phase of the largest vernier offset response shows slowing of the response in the affected eyes (53°) compared with the fellow eyes (34°). Response amplitudes were diminished in the affected eyes, relative to the fellow eyes. This is demonstrated by the distance of the vector from the center of the plot.

