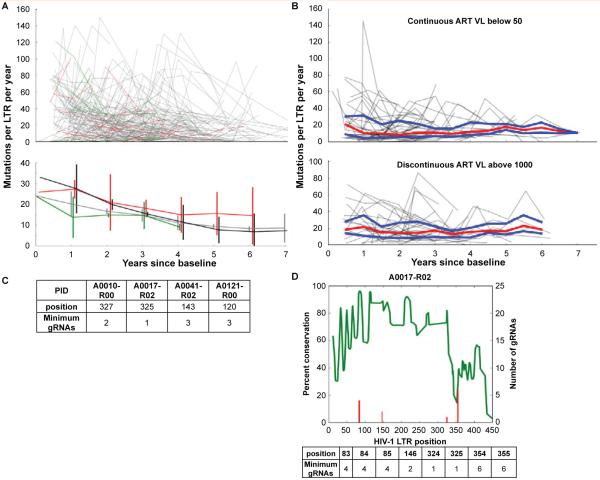
Figure 1. HIV LTR genetic variation and gRNA design in well-controlled patients.
Consecutive visits were compared by individually aligning all sequences from each patient using the MUSCLE alignment tool [33] and calculating the number of variations between consecutive visits. The number of nucleotide changes per 100bp was plotted against the time since the baseline visit to determine the rate of accumulated variations.
A: Line segments from each patient were generated from the longitudinal variation based on the anti-retroviral therapy (ART) status between consecutive visits using the following coding scheme: green line segments indicate a longitudinal visit in which the patient was naive to ART (21 patients), red line segments indicate off/non-adherent ART visits (39 patients), grey line segments indicate on/adherent ART visits (168 patients), and black line segments on/adherent ART (54 patients) with viral loads always below 100 copies per ml. The top panel depicts all longitudinal samples per patient. The bottom panel shows median and standard deviation for each group at each year.
B: LTRs from 45 patients on/adherent ART and 31 patients with discontinuous ART for at least three consecutive visits were analyzed as in A. The trajectory of each patient is shown in grey with the median in red and the upper and lower quartiles in blue.
C: Utilizing Roche 454 next generation sequencing (NGS), NGS on genomic DNA isolated from PBMCs of 6 patients and 8 samples was performed on a 4.4kb fragment of the HIV genome, as previously described [32]. The number of gRNAs and target position for each patient sequenced was determined by aligning the short-read sequences to the HXB2 genome using the BWA aligner [34] and a local implementation of the algorithm used by the CRISPR design tool [24]. 23-mer sliding windows were constructed by extracting all completely overlapping reads and checked for a PAM sequence; all windows with less than 50 overlapping reads were excluded. The minimal number of gRNAs required to cleave each targetable window was calculated by testing all possible gRNAs.
D: NGS reads from patient 17 visit 3 were mapped to HXB2 using the BWA aligner [34] as described above and examined for percent conservation (green line) and number of gRNAs necessary for excision of all known quasispecies (red line) at every position of the LTR. A table of the position and number is provided below the graph.

