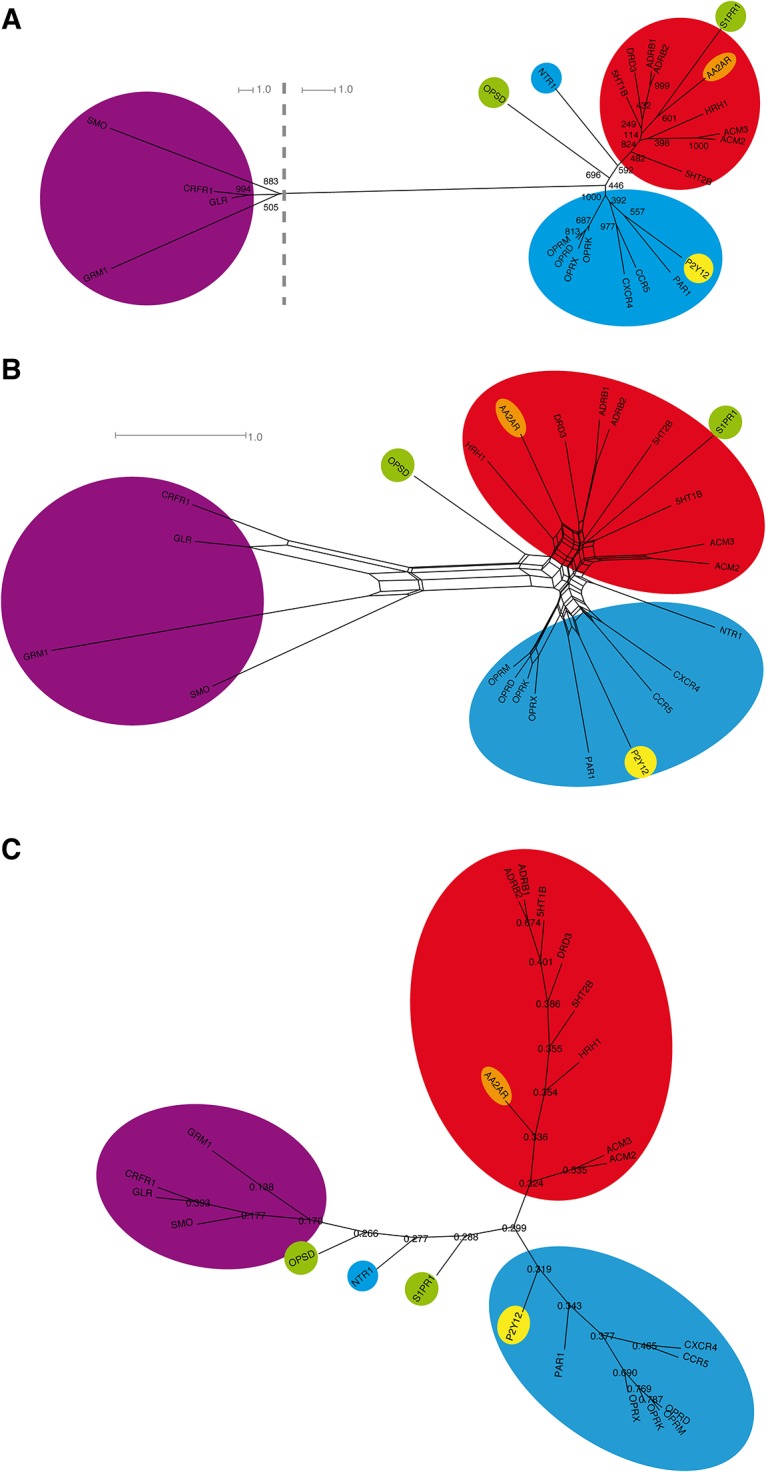
Fig 1. Phylogenetic analysis of the GPCR crystal structure set.

Maximum likelihood tree (A) analysis, maximum likelihood distance-based NeighborNet (B), and Evolutionary Trace sequence similarity-based tree (C) of the 7TM domain of crystallized receptors [3–28]. Naming according to the Uniprot database [53]. Receptors with hydrophobic residues highlighted in green, adenosine receptors in orange, biogenic amine receptors in red, non-rhodopsin-like receptors in purple, peptide-binding receptors in cyan, purine receptors in yellow. Numbers in (A) denote how often the respective node was found in bootstrap replicas (1000 samples in total). Numbers in (C) denote the ratio of sequence similarity between both sequence groups forming the respective node. The two tree analyses show a separation of rhodopsin-like GPCRs into small molecule receptors, i.e. amine receptors, on one side, and peptide/purine receptors on the other side, with rhodopsin (OPSD) being in between both subgroups. The connection with the non-rhodopsin-like GPCRs is formed in the middle between both branches, too, and is positioned close to rhodopsin and neurotensin receptor 1 (NTR1). The network and both tree analyses all show a good topological agreement, indicating a general tree-like evolution signal. However, the network exhibits large meshes around the connection point of non-rhodopsin-like and rhodopsin-like GPCRs, indicating a certain ambiguity about their precise connection.
