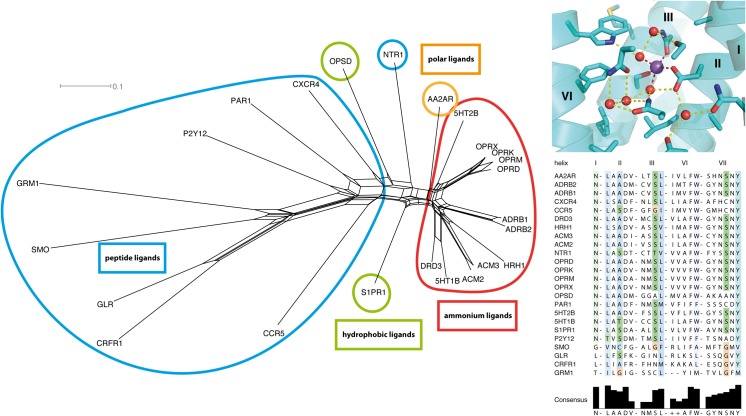
Fig 6. NeighborNet analysis of GPCR sodium binding sites.
Uncorrected P distance based NeighborNet analysis of residues forming the central sodium / water binding site in GPCR crystal structures. Left: NeighborNet analysis. The network analysis reveals four dominant categories of ligand binding cavities: peptide ligand receptors (cyan), hydrophobic ligand receptors (green), containing opsins and sphingosine receptors, polar ligand receptors (orange), containing adenosine receptors; and ammonium ligand receptors (red), containing muscarinic acetylcholine receptors, biogenic amine receptors, and opioid receptors. The overall topology of the network is in good agreement with the one of the ligand binding site presented in Fig 5, which suggests an evolutionary connection between both sites. Top right: overview of residues forming the central sodium/water binding site (in PDB ID 4N6H [35]). Sodium in purple sphere, water oxygen atoms in red spheres, binding site forming amino acids as sticks. Bottom right: sequence comparison of analyzed amino acid positions.

