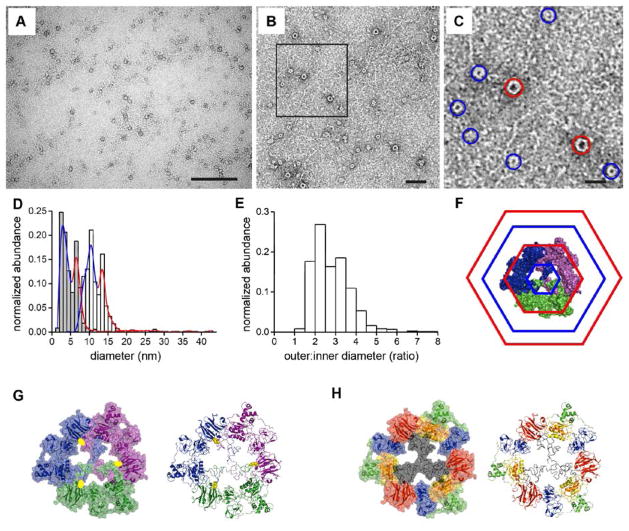
Figure 4. TEM analysis and molecular model of proMMP-9 trimers.
(A) TEM overview image. The proMMP-9 trimers occur as negatively stained round structures. Scale bar, 200 nm. (B) Representative TEM image of proMMP-9 trimers at higher magnification. Scale bar, 50 nm. (C) Magnified area from panel B. Two populations of proMMP-9 trimers of different sizes are indicated by blue (small conformers) and red (large conformers) circles. Scale bar, 20 nm. (D) Statistical analysis of TEM images (n = 868) revealed two distinct maxima for the outer (white histogram) and inner (grey histogram) diameters, indicating the presence of two size populations of the proMMP-9 trimers. For the large conformers of proMMP-9 trimers (red circles in C), an inner diameter of 6.9 ± 0.8 nm (mean ± SD) and an outer diameter of 14.1 ± 2.2 nm have been obtained. For the small conformers (blue circles in C), an inner diameter of 2.8 ± 0.7 nm and an outer diameter of 10.8 ± 2.1 nm have been obtained. The colored curves indicate distribution of small (blue) and large (red) conformers. (E) Histogram, distribution of the ratios between the outer and inner diameters of proMMP-9 trimers. Mean = 2.84 ± 0.82. (F–H) Molecular models of trimeric proMMP-9. The models assume that the Cys468 and Cys674 are involved in trimerization. (F) Model of trimeric proMMP-9 based on the AFM and TEM data. Hexagons indicate the inner minimal and the outer maximal diameters of the large (red) and small (blue) proMMP-9 conformers. (G) 3D model of a proMMP-9 trimer. A space filling model (left panel) and a cartoon model (right panel) with the three monomers in different colors, illustrate the intermolecular cysteine bridges (in yellow) between the monomers. (H) A space filling model (left panel) and a cartoon model (right panel) depicting the functional domains of proMMP-9 in the trimeric structure. The same color code was adopted as used in Figure 1. The molecular orientations are the same as in panel G.

