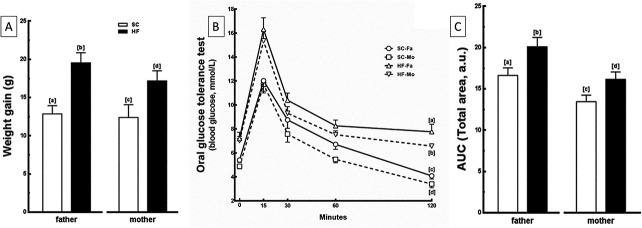
Fig 2. Parental data.

(A) Pre-mating weight gain, (B) Oral glucose tolerance test (OGTT) and (C) Area under the curve (AUC) from OGTT of fathers and mothers. Data are expressed as the mean and SD for n = 5 mice per group in all analyzes (one way ANOVA and the posthoc test of Holm-Sidak). Same letters represent equal groups with no statistical difference while different letters represent different groups from each other, with statistical difference (P<0.05). Abbreviations: father that received standard chow (SC-Fa); father that received high-fat diet (HF-Fa); mother that received standard chow (SC-Mo); mother that received high-fat diet (HF-Mo); area under the curve (AUC) and arbitrary units (a. u.).
