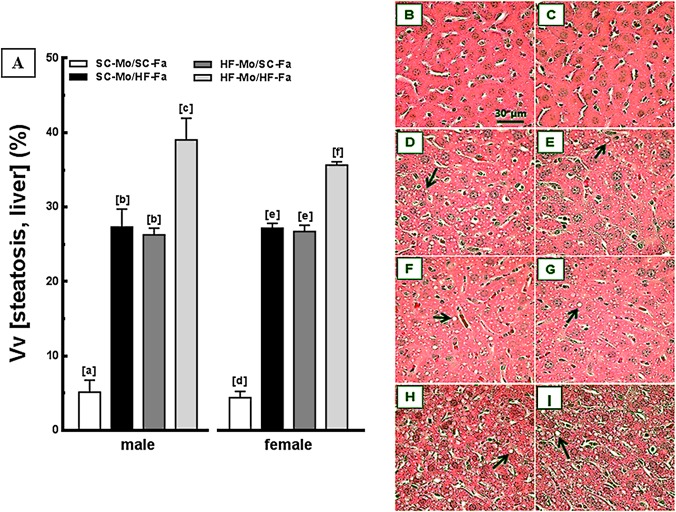
Fig 4. Offspring data: liver.
(A) Volume densities (Vv) of steatosis (left frame, n = 5 mice per group) and photomicrographs of the liver (right frame, B-I) from male and female offspring at 12-weeks old (HE staining). Data are expressed as the mean and SD (one-way ANOVA and the posthoc test of Holm-Sidak). Same letters represent equal groups with no statistical difference while different letters represent different groups from each other, with statistical difference (P<0.05). Photomicrographs: B and C—male and female offspring of SC mother and SC father, respectively (SC-Mo/SC-Fa); D and E—male and female offspring of SC mother and HF father, respectively (SC-Mo/HF-Fa); F and G—male and female offspring of HF mother and SC father, respectively (HF-Mo/SC-Fa); H and I—male and female offspring of HF mother and HF father, respectively (HF-Mo/HF-Fa). Offspring of obese mother or obese father and both obese parents present numerous hepatocytes with fat droplets (arrows).

