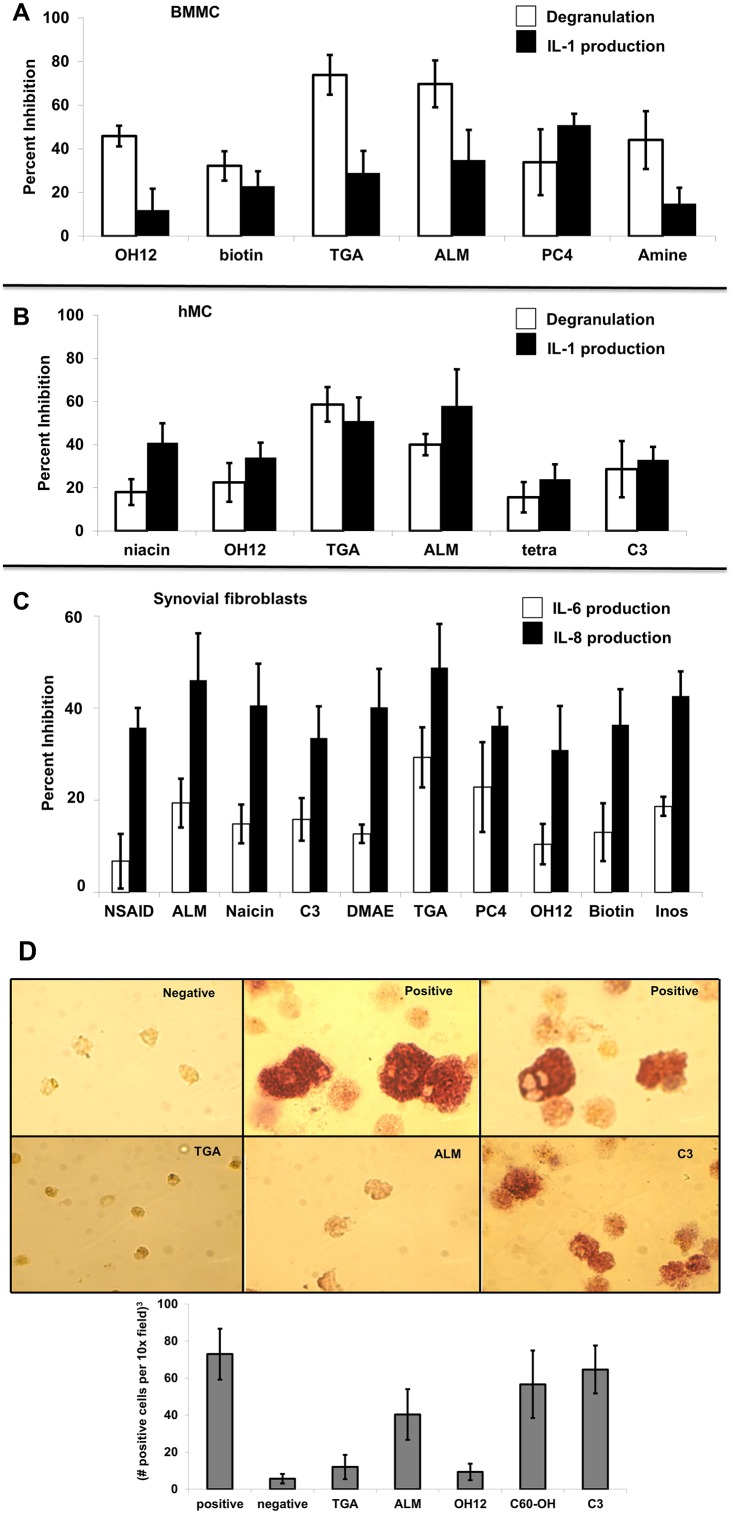
Fig 1. Fullerene derivatives reduce degranulation and cytokine production from synovial fibroblast from RA patients, mouse BMMC, and human MC (hMC), and osteoclast formation from human PBMC.
Fig 1A shows FcγRII-null BMMC incubated with fullerene derivatives overnight (10 μg/ml). The next day anti-FcγRII/III antibody 2.4G2 or isotype control was added followed by cross-linking donkey anti-rat (DAR) F(ab)2. Cells were centrifuged and β-hexosaminidase release or IL-1 production determined in supernatants or lysates, respectively. Data shown are means ± SE of triplicate samples that is representative of three experiments. All data was statistically significant with P values < 0.05. In Fig 1B tissue MC were incubated with fullerene derivatives (10 μg/ml) overnight, washed and preformed IgG anti-NP–NP-BSA immune complexes [8.8 μg/ml anti-NP Ab with 0.13 μg/ml NP-BSA [35]], were incubated with MC for 30 minutes or four hours. Supernatants and cell lysates were prepared for mediator release analysis as described. Data is expressed as mean ± SE from three individual experiments. P values < 0.05 by ANOVA when experimental values are compared with the Ab-only control (not shown). Fig 1C shows fullerene derivatives can inhibit cytokine production from rheumatoid arthritis-derived synovial fibroblasts. Synovial fibroblasts from RA patients were preincubated with or without various fullerene derivatives (10 μg/ml) overnight, washed, and incubated with TNF-α (10 ng/ml for 12 hours). Supernatants were saved and cytokines measured in the supernatants. The percent inhibition of the treated cells was calculated based on the release of cytokines from non- fullerene derivative treated cells. Fig 1D shows the ability for fullerene derivatives to inhibit osteoclast formation. Human PBMC were incubated without (negative) or with RANK ligand (30 ng/ml) and GMCSF (25 ng/ml). After one hour fullerene derivatives were added (10 μg/ml) and remained throughout. In order to verify the differentiation of mononuclear cells to osteoclasts, after eight days of culture, cells were analyzed for tartrate resistant acid phosphatase (TRAP) activity by cytochemistry. The cells with the reddish color represent osteoclast formation and are quantified in the graph (bottom). Results are representative of two separate experiments. Magnification 40X.

