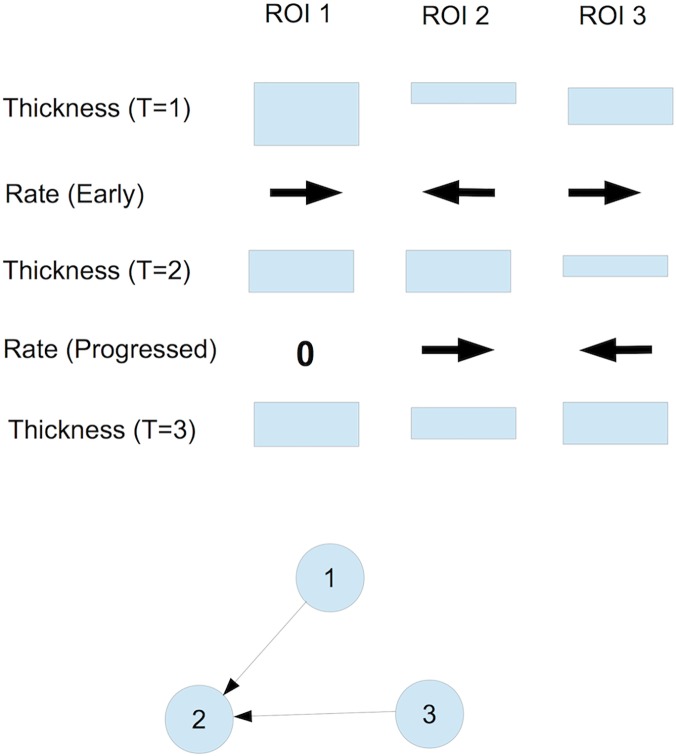
Fig 1. DPNet construction.
Schematic DPNet Construction for three regions-of-interest (ROIs) based on three yearly (T = 1,2,3) MRIs. ROI 1 thins in the early period (large positive thinning rate) and remains unchanged (0 rate) in the progressed period. ROI 2 thickens in the early period and thins in the progressed period. ROI 3 thins in the early period and thickens in the progressed period. Thus, the DPNet has edges from 1→2 and 3→2 showing the thinning progression and possible disease progression. However, even though the rate in the early period for ROI 2 is similar to the rate for ROI 3 in the progressed period, there is no edge from 2 to 3, since a negative thinning rate is not evidence of a diseased ROI. Intuitively, we see that ROIs 1 and 3 are thinning in the early period, which implies that they are diseased early, while ROI 2 appears diseased in the progressed period and may have been infected by ROI 1 or 3 or perhaps both, which is represented by the directed edges.

