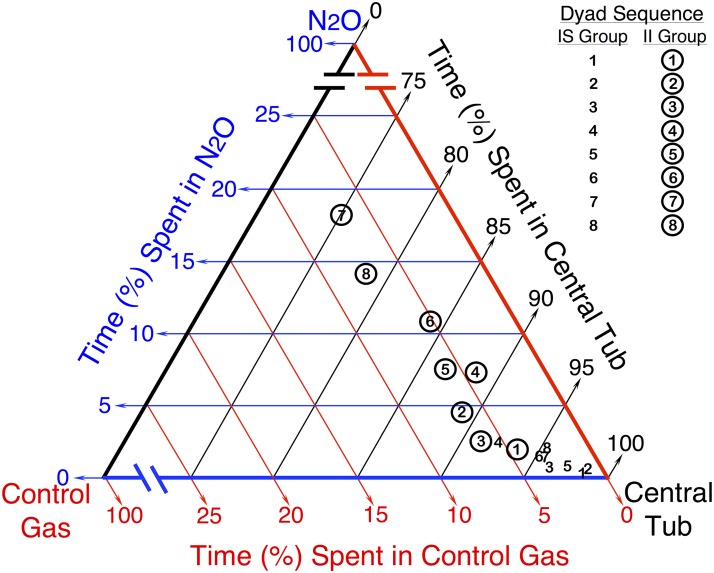
Fig 2. N2O Self-Administration Data for Initially Sensitive and Initially Insensitive Rats.
Ternary diagram depicting the centered geometric mean proportions of time spent in each chamber for each of the eight 44-h dyads during N2O availability. The numbers 1–8 depicted in the figure represent the sequential order of self-administration dyads. Circled numbers represent dyads for initially insensitive rats (II, n = 16) while uncircled numbers represent dyads for the initially sensitive rats (IS, n = 16). The position of each point relative to the three color-coded axes indicates the proportion of time spent in the central tub (black), control gas chamber (red), and 60% N2O chamber (blue) during a 44-h dyad.

