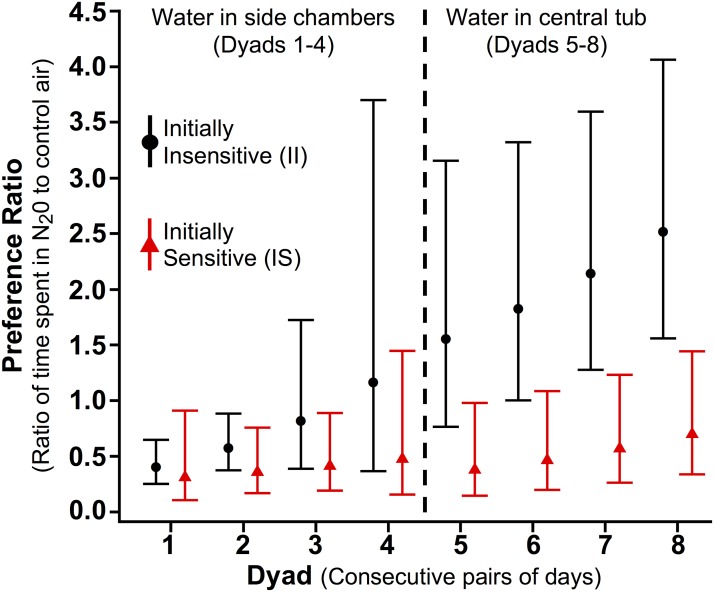
Fig 3. Statistical Comparison of the N2O Preference Ratio for Initially Sensitive and Initially Insensitive Rats.
The N2O preference ratio is the ratio of time each rat spent in the N2O chamber versus the control air chamber during each dyad, and was compared between initially insensitive (II, black circles) and initially sensitive (IS, red triangles) rats using linear modeling applied to log-transformed ratios. Points represent geometric means and error bars are pointwise 95% confidence intervals. Ratio comparisons were statistically significant in each of Dyads 5–8. During Dyads 5–8, the II group’s mean N2O preference ratio was 3.68-fold higher than that of IS rats (95% CI: 1.48–9.20; p = 0.003). For Dyads 1–4, the preference ratio was 1.84 times greater than that of the IS group (95% CI: 0.80–4.40), but this difference did not reach statistical significance (p = 0.075). The group-by-dyad interactions were not statistically significant for Dyads 1–4 (p = 0.227) or for Dyads 5–8 (p = 0.343).

